Tag: 2026

  • NQ Futures Price Action Commentary

    NQ Futures Price Action Commentary

    Michael explains how he used price action and key levels to anticipate a possible market reversal and subsequent rise.

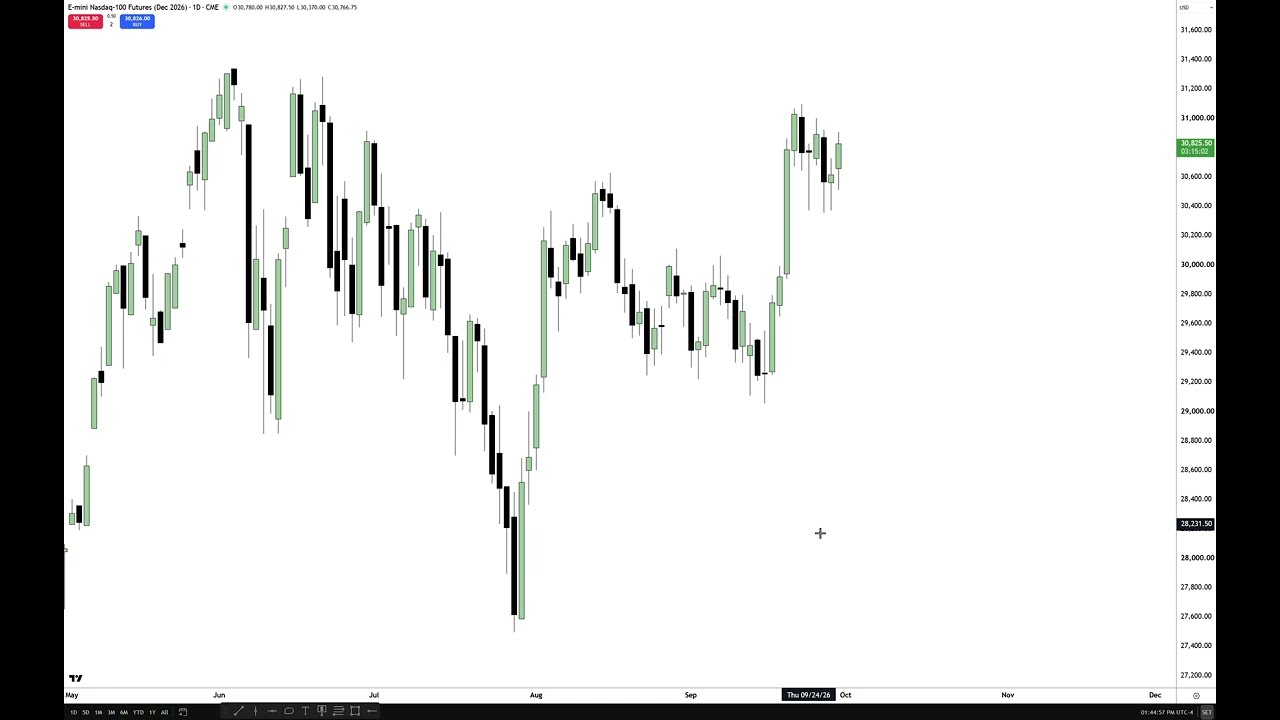
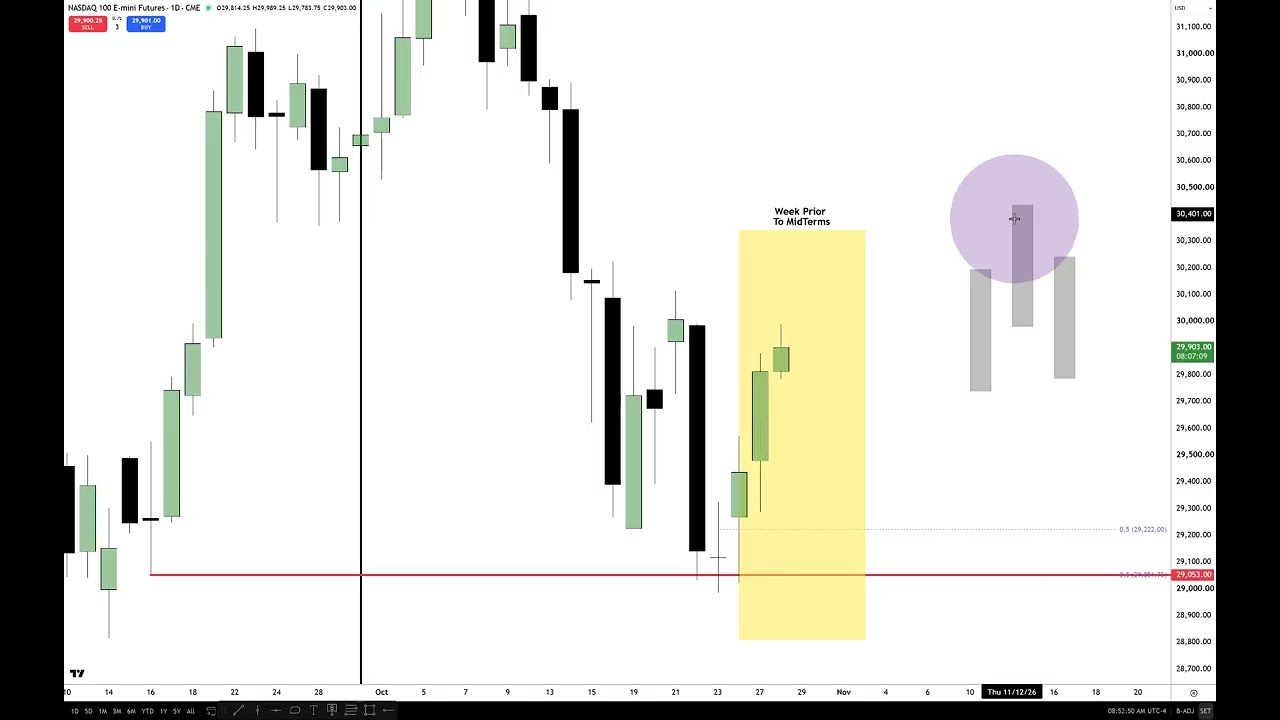
    – He focused on a prior low at **29,053**, arguing that price had already tested nearby sell-side liquidity and showed little follow-through lower. A later higher low suggested a potential daily swing low.
    – He demonstrates comparing chart settings to identify which best displays wick ranges and gaps between candle bodies, which he interprets as volume imbalances.
    – He combines daily-chart levels—such as wick midpoints and inversion fair-value gaps—with one-minute price action to identify likely support, resistance, and targets.
    – Michael notes a modest tendency for markets to rise ahead of U.S. elections, but treats it as context rather than a certainty.
    – He outlines a short trade during the pre-market consolidation, using projected range levels to manage the entry, stop, and exit near sell-side liquidity before the broader move higher.
    – He also advises labeling and carrying forward new-day opening gaps, using New York time, and treating losses as information that may require reassessing a trade or bias.

    His broader message is to follow a tested trading model, forecast from defined evidence, and avoid emotional reactions to either losses or price movements.
  • Market Review On NQ December Price Delivery

    Market Review On NQ December Price Delivery

    https://www.youtube.com/watch?v=9YS41OoxbX4

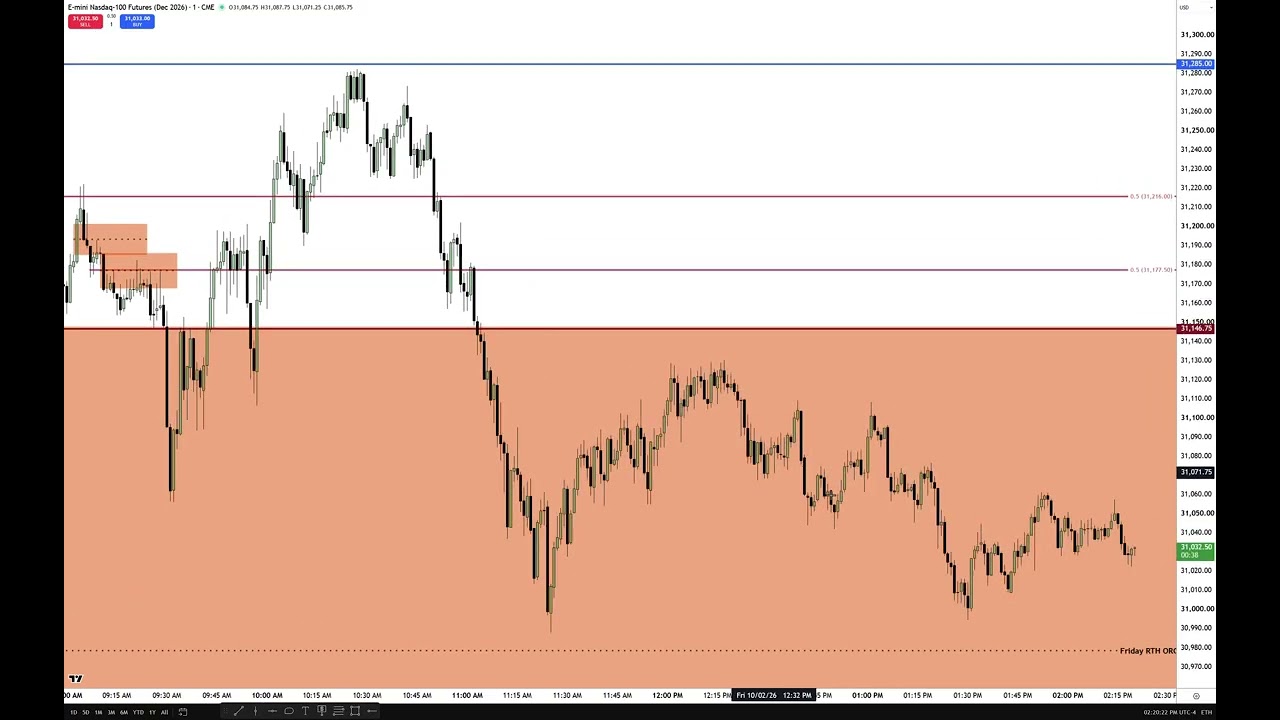
    Michael reviews a live NASDAQ futures tape-reading session from the 9:50–10:10 a.m. Eastern macro window. He explains how he used fair value gaps, candle bodies, liquidity levels, and risk points to anticipate a move toward 29,950, with two partial profit-taking opportunities along the way.

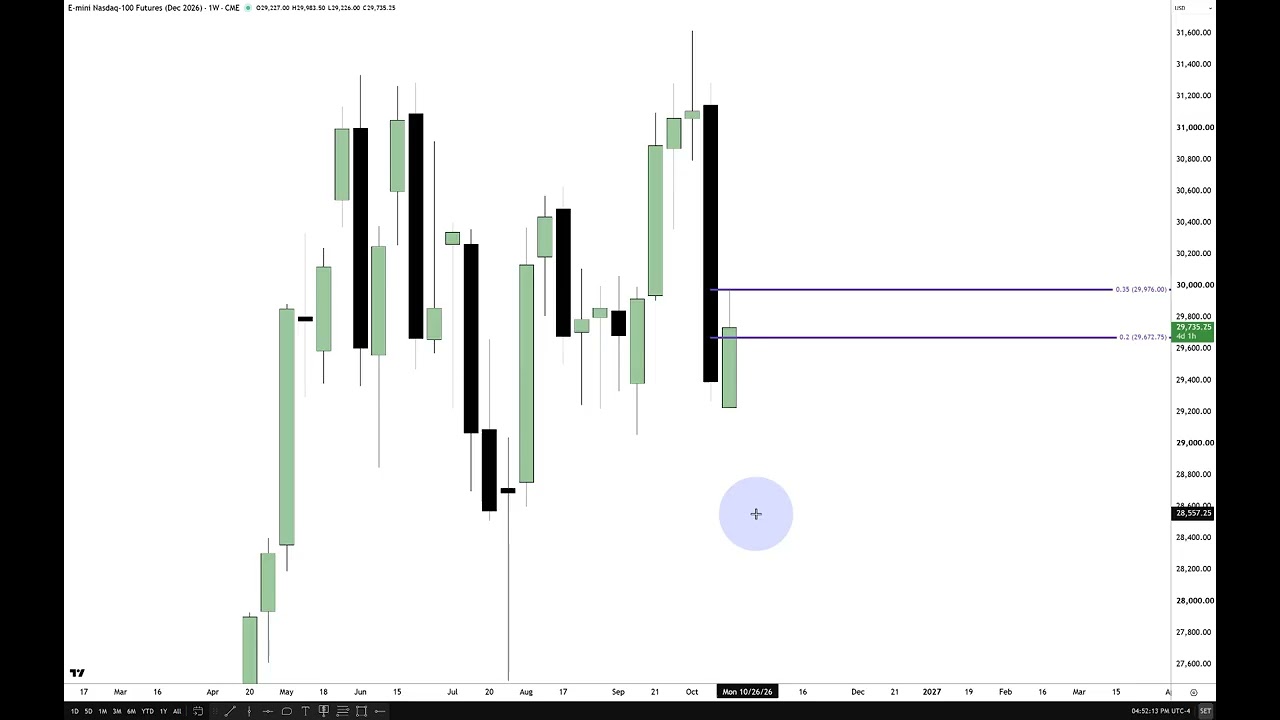
    He connects the move to his “TGIF” framework: after a sharp down week without the expected Friday retracement, the following week may recover roughly 20–30% of the prior weekly range, sometimes as much as 40%. He says the session reached about 35%, then reversed near a key level.

    Michael emphasizes focusing on a few higher-timeframe ideas rather than tracking many indicators or trying to capture every market fluctuation. He also says he will stop posting execution videos because he believes they are being misused to promote trading services.

  • NonFarm Payroll October 2026 Lecture

    NonFarm Payroll October 2026 Lecture

    https://www.youtube.com/watch?v=59Elm8myGEc

    Michael reviews NQ price action around the non-farm payroll (NFP) release. He says the broader daily outlook was bullish, with a prior June high as an upside reference, but he avoids predicting the initial reaction to major economic news because it can be unpredictable.

    His approach was to wait for the post-release move, then look for a retracement and signs of weakness. Using the 8:30–9:30 price range, a short-term high, the prior daily high, and related chart levels, he identified a potential “event horizon” area to fade. He describes entering short after price showed rejection, taking partial profits as it moved lower, and reducing risk when the decline stalled; he says price later reached his lower target after he had exited.

    His main lessons are to avoid chasing NFP volatility, manage risk and bank partial profits, and focus on a few clear price-action signals—such as gaps, order blocks, and candle behavior—rather than piling on indicators. He frames the setup as an advanced, occasional model, not a reliable trade for every news release.

  • NQ AM Session Review 09/30/2026

    NQ AM Session Review 09/30/2026

    https://www.youtube.com/watch?v=kRShZKZlvJ4

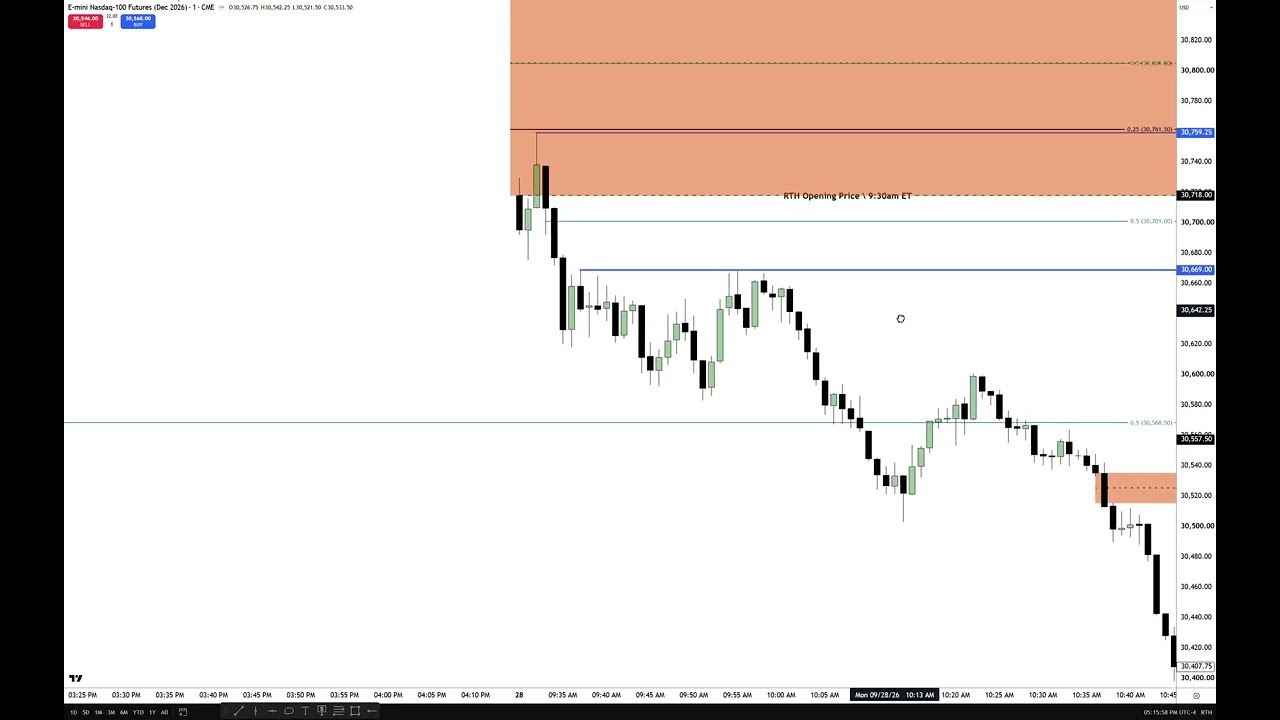
    Michael reviews Nasdaq’s session, noting that an 8:30 news release drove a sharp rally after early consolidation and reversed London-session weakness. Price reached and fully closed Monday’s regular-hours opening gap, as he had anticipated. He explains his long entry near an inversion fair value gap, partial exits during the advance, and later signs of bearish order flow.

    He advises newer or impulsive traders to avoid trading for the rest of a non-farm-payroll week, when volatile price action can encourage poor decisions. He closes by noting the month’s end and encouraging viewers to make good use of their time.

  • NQ December Asian Session Execution 09/29/2026

    NQ December Asian Session Execution 09/29/2026

    https://www.youtube.com/watch?v=7M56e9O06Ko

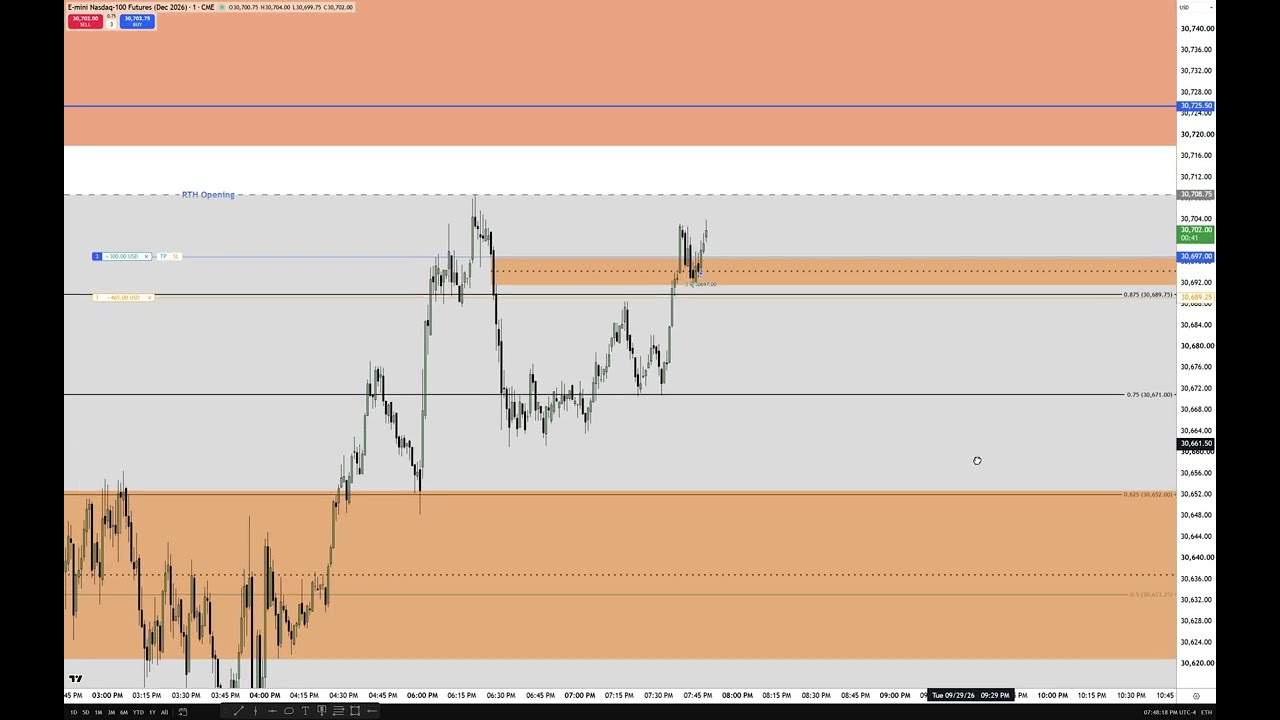
    Michael demonstrates a live Asian-session long trade based on an inversion fair value gap, aiming for nearby pools of liquidity. He adds to the position as price respects the gap and related price-action levels, takes staggered partial profits, and raises his stop to protect gains. Although price ultimately stops out the remaining position before reaching his ideal target, earlier exits make the trade profitable. He emphasizes using clear risk limits, explaining the setup in real time, and showing that not every trade reaches its final objective.

  • NQ AM Session Low Of Day Long Review

    NQ AM Session Low Of Day Long Review

    https://www.youtube.com/watch?v=UVVmS0de0g0

    Michael reviews his NASDAQ trades and explains a method built around price action, rather than volume indicators or news. He identifies a lower opening gap, reads price’s failure to reach key gap levels as bearish, and watches for a move toward a prior daily low and related liquidity levels. After price reaches that area during a scheduled “macro” time window and fails to hold below it, he treats the response as bullish and enters long, targeting nearby highs and the session’s opening price. He later exits most of the position as price stalls near resistance, with the remainder stopped out.

    His main points are to combine time, market context, liquidity, gaps, and candle behavior; plan for likely moves instead of reacting to them; and keep chart analysis focused on open, high, low, and close. He argues that macro windows help anticipate when price may move, while cautioning that beginners may find Monday sessions harder to trade.

  • NQ Dec Futures September FOMC Trade Review

    NQ Dec Futures September FOMC Trade Review

    https://www.youtube.com/watch?v=50VbES10ULs

    Summary:

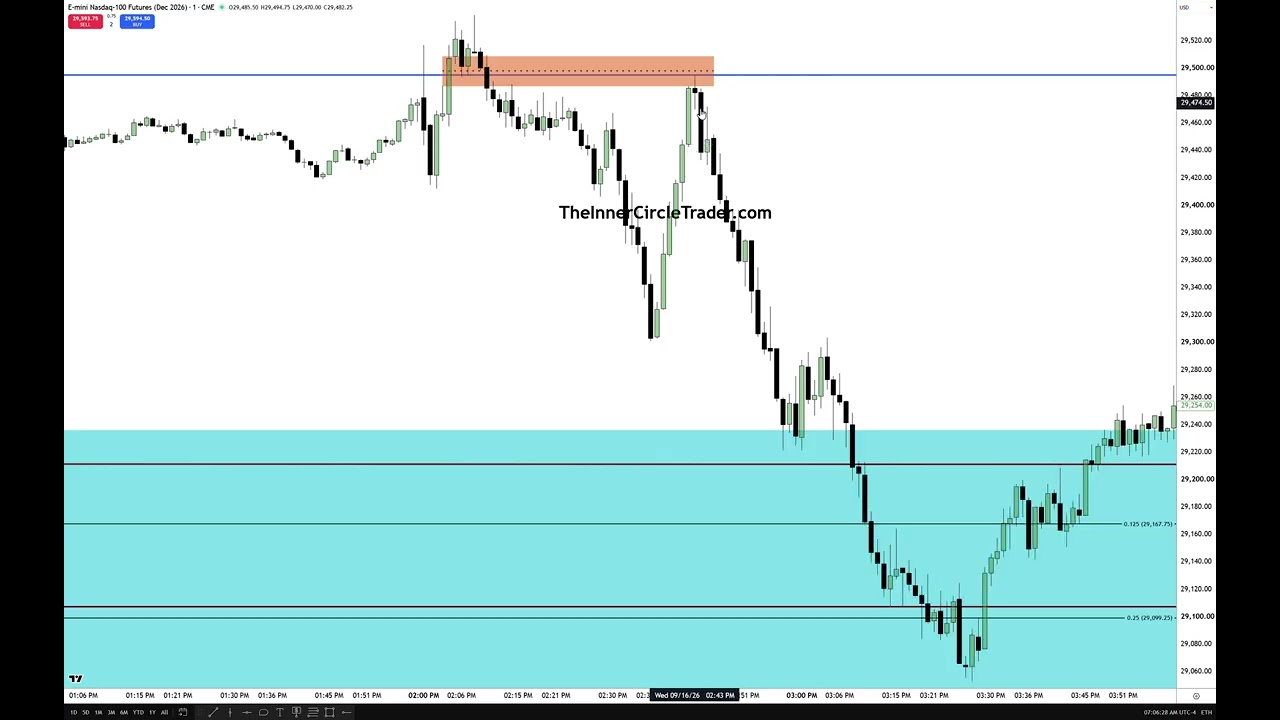
    – The speaker reviews the NASDAQ daily and lower-timeframe action around the September 2026 FOMC, marking Monday and Tuesday intraday highs/lows and a blue-shaded daily “suspension block.”
    – They highlight a two-stage FOMC move: price pierced Tuesday’s high, formed an inversion fair-value gap/inefficiency, then failed and sold off into the suspension block, ultimately taking out Monday’s low.
    – Trading method emphasized: identify inefficiencies/fair-value gaps, use candlestick wicks and volume balance, anchor swing projections to the 50% level, and keep a clean chart with reference notes.
    – The speaker predicted a large range expansion before the open, took partials during the move, and reports a profitable trade (~$33,800), with fills around 29,483.25–29,483.75.
    – Practical tip: on FOMC days the “sweet spot” for entries often forms around 2:40–2:50 p.m. ET.
    – Miscellaneous: recording/technical issues, frustration with others copying content, and a reminder that September is National Preparedness Month.

  • How New Students Should Start Part 5 \ Back Testing Properly

    How New Students Should Start Part 5 \ Back Testing Properly

    https://www.youtube.com/watch?v=xnbtp_j81lI

    Summary — key points and main ideas

    – Big picture: Keep backtesting and price-reading simple and disciplined. Use the three core “smart money” concepts (introduced earlier) as models you can build from; every concept can be turned into a standalone, usable model.

    – Personal responsibility: Pay for minimal tools if you trade live (TradingView real‑time is ~$7). If you can’t afford live data, study historical/delayed data — don’t expect handouts.

    – Avoid Market Replay: Market Replay is discouraged because it doesn’t show the full lifespan (birth-to-death) of each candlestick. That full intrabar movement is essential to learn real-time tape reading.

    – Record and review real (or delayed) price action: Screen‑record sessions (Windows tip: Win + Alt + R) or narrate your observations. Watching recorded price action lets you study each candle’s behavior and condition your subconscious through repetition.

    – Backtest method: Do a minimum of six weeks backward and six weeks forward of structured backtesting. Log observations, hypothetical entries, stops, risk, time/drawdown, and treat them as if real to build practical experience.

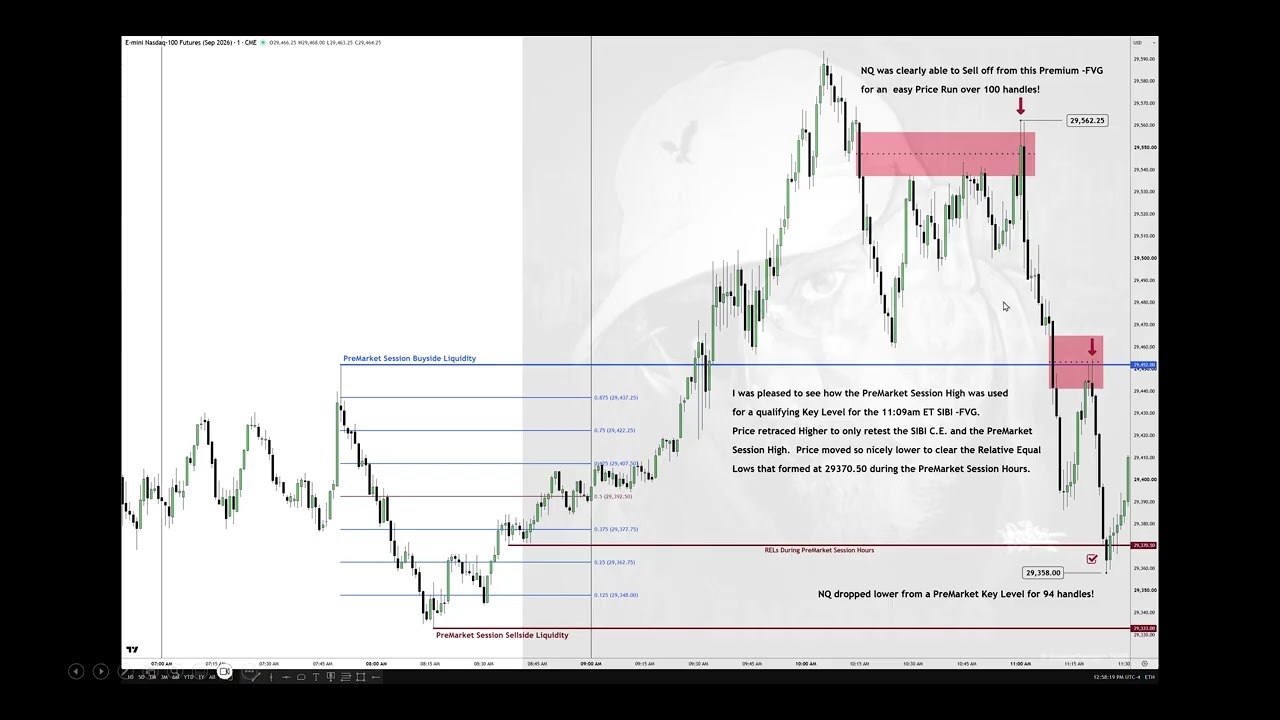
    – Chart annotations and precision: Annotate pre‑market (7–9 ET) highs/lows, draw Fibs, mark relative equal highs/lows, opening range (9:30–10:00) and opening‑range gaps (RTH close to next open). Use exact prices (price notes), enlarge fonts, and fill empty chart real estate with detailed observations.

    – Opening‑range gaps and projections: Classify gaps as discount/premium (open vs prior RTH close). Use mid‑gap/consequent encroachment and Fib negative‑1 projections to identify likely intraday targets and extremes.

    – The “silver bullet” — 10:00 hour and First‑Presented Fair Value Gap (FPFVG): Mark 10:00 and identify the first presented FVG and whether it has displacement. Combine FPFVG, 10:00 low (lunch macro), relative equal highs/lows and other context to create high‑probability narratives for entries, realistic stops (e.g., last outside candle high +1 tick), partials and risk sizing.

    – Mindset and journaling: Keep notes positive and constructive to build confidence. Treat your journal as private training material that creates “pseudo‑experience” and shortens the learning curve. Record losing days constructively.

    – Final points: Be consistent — backtesting and disciplined journaling are the paths to reading live price action. Don’t rely on black‑box tools or AI to replace human real‑time candlestick interpretation; practice will develop those skills.

  • NQ Futures Review & 1st Presented Reflection FVG

    NQ Futures Review & 1st Presented Reflection FVG

    https://www.youtube.com/watch?v=9W4YpyAg5RY

    Summary:

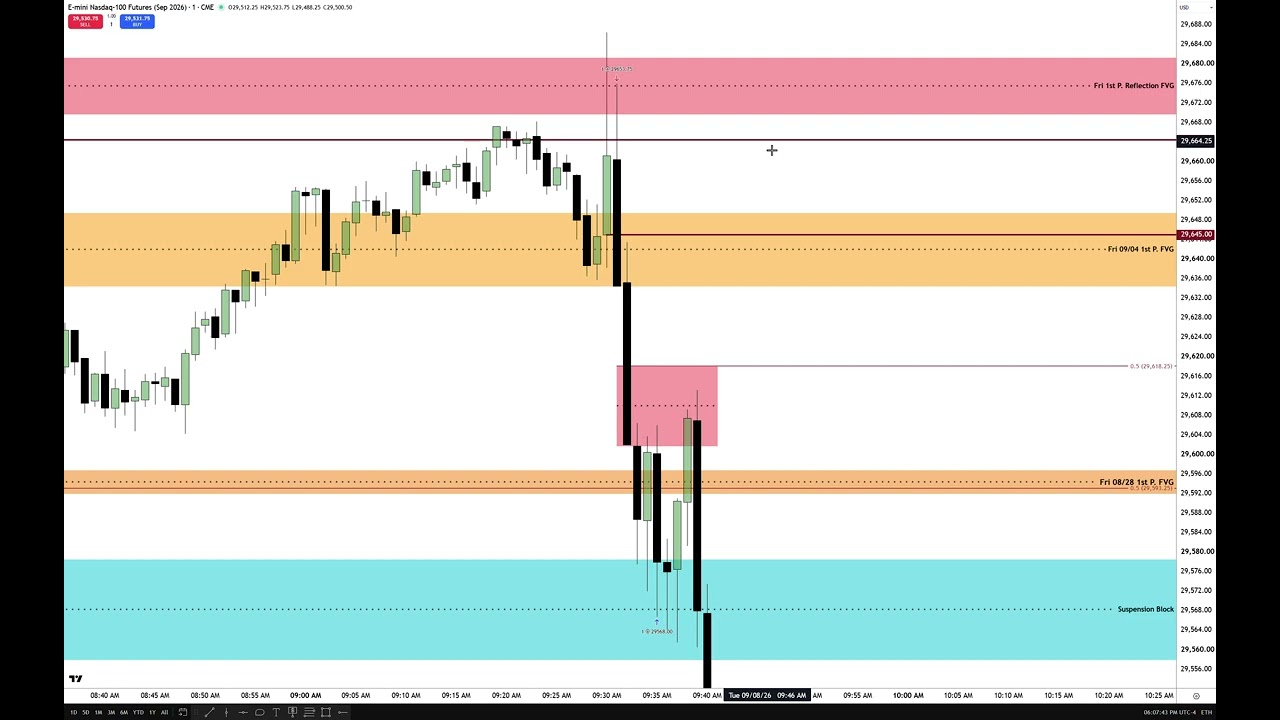
    The speaker reviews recent price action and explains three related PD arrays (PDAs): the first presented fair value gap (FVG), the first presented FVG with displacement (more significant because it clears a prior high/low), and the reflection FVG (the first opposite-characteristic gap after the initial FVG). Key practical rules: focus on the first opposing characteristic that forms after the 9:30 Eastern open, give greater weight to FVGs with displacement, and treat the reflection FVG as a mirror/opposite of the first presented FVG.

    Using examples from last Friday through this morning, the speaker shows how these levels (extended to the right) and midpoints of wicks guide entries, stops, and targets. Important tactical points: bodies closing in the lower half of a gap signal weakness; wicks and midpoint behavior are meaningful; use pre-market (7–9 a.m.) and London session levels as context; and prefer “low-hanging fruit” exits and smaller position sizing immediately after holidays because volume and behavior can be unpredictable.

    Teaching/philosophy: this method is detailed and requires independent study—keep notes, topical journals, and do due diligence. The presenter emphasizes disciplined application over simplicity and warns that critical or lazy commentary will be muted.

  • How To Engage Price After Holiday Volume Days

    How To Engage Price After Holiday Volume Days

    https://www.youtube.com/watch?v=VBgfJRMVCaI

    – Market opened after the holiday with a roughly 100-handle premium gap (fair value gap from prior Friday). The trader watched for fills to key levels: half-gap, suspension block (sell-side liquidity), and volume-imbalance/CBI zones.
    – Trading approach: start light after a holiday (one contract, paper trading) to get a feel for price action and avoid forcing trades when volume and behavior can be wonky.
    – Execution rules highlighted: place stops just above wick highs (or above the second wick high), target sell-side areas inside wicks and volume imbalances, and take partial profits when new lows form.
    – Observations: NASDAQ showed relative weakness; price stayed in lower halves of key zones (premium sensitivity), which signaled likely further downside. The market filled half the gap then sold off and ultimately took out recent lows.
    – Reviewed recent context: referenced last Friday’s fair value gap, new-week opening gaps, and an Asia session CL example where an entry near 595.25 briefly went against the trader before rallying—illustrating use of gaps and stops.
    – Key teaching point: after holidays trade light to align with price action, use gap/CBI/volume-balance rules, protect risk with stop placement, and take partials to lock in gains rather than wait for a single terminal profit.
    – Closing: recording to be posted for teaching; overall session validated the stated rules and approach.