Year: 2026

  • How New Students Should Start Part 5 \ Back Testing Properly

    How New Students Should Start Part 5 \ Back Testing Properly

    https://www.youtube.com/watch?v=xnbtp_j81lI

    Summary — key points and main ideas

    – Big picture: Keep backtesting and price-reading simple and disciplined. Use the three core “smart money” concepts (introduced earlier) as models you can build from; every concept can be turned into a standalone, usable model.

    – Personal responsibility: Pay for minimal tools if you trade live (TradingView real‑time is ~$7). If you can’t afford live data, study historical/delayed data — don’t expect handouts.

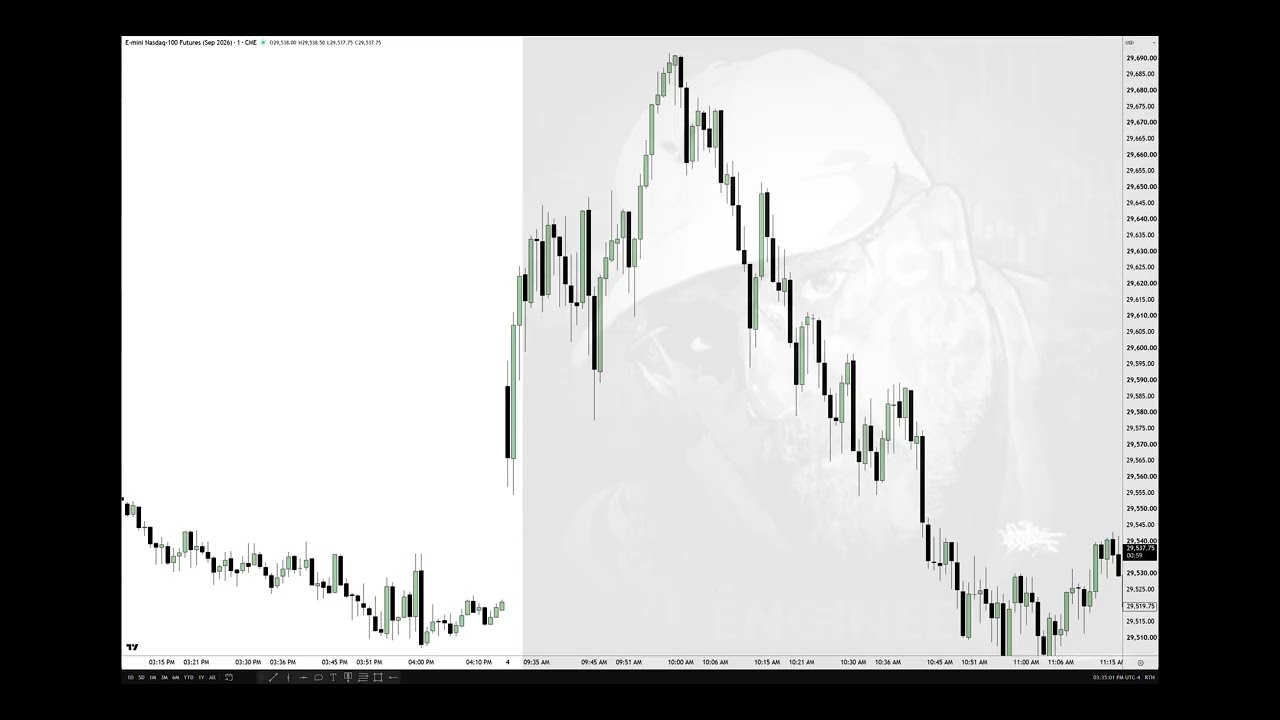
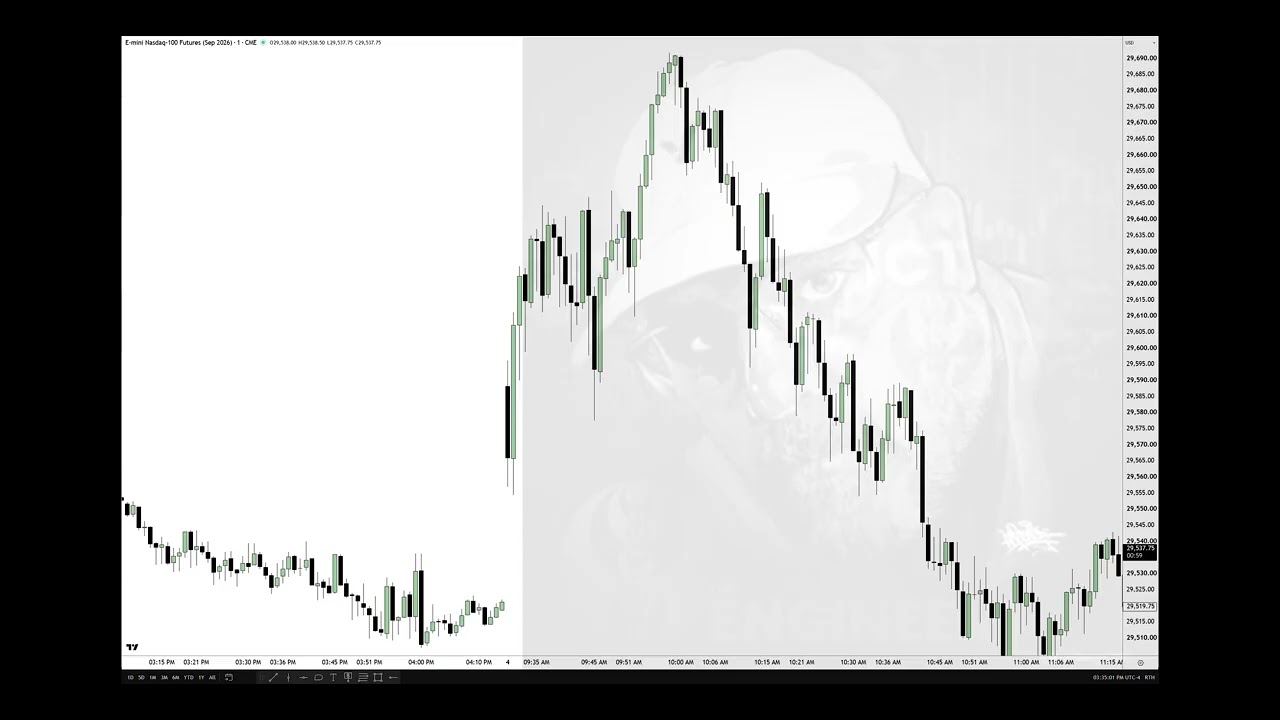
    – Avoid Market Replay: Market Replay is discouraged because it doesn’t show the full lifespan (birth-to-death) of each candlestick. That full intrabar movement is essential to learn real-time tape reading.

    – Record and review real (or delayed) price action: Screen‑record sessions (Windows tip: Win + Alt + R) or narrate your observations. Watching recorded price action lets you study each candle’s behavior and condition your subconscious through repetition.

    – Backtest method: Do a minimum of six weeks backward and six weeks forward of structured backtesting. Log observations, hypothetical entries, stops, risk, time/drawdown, and treat them as if real to build practical experience.

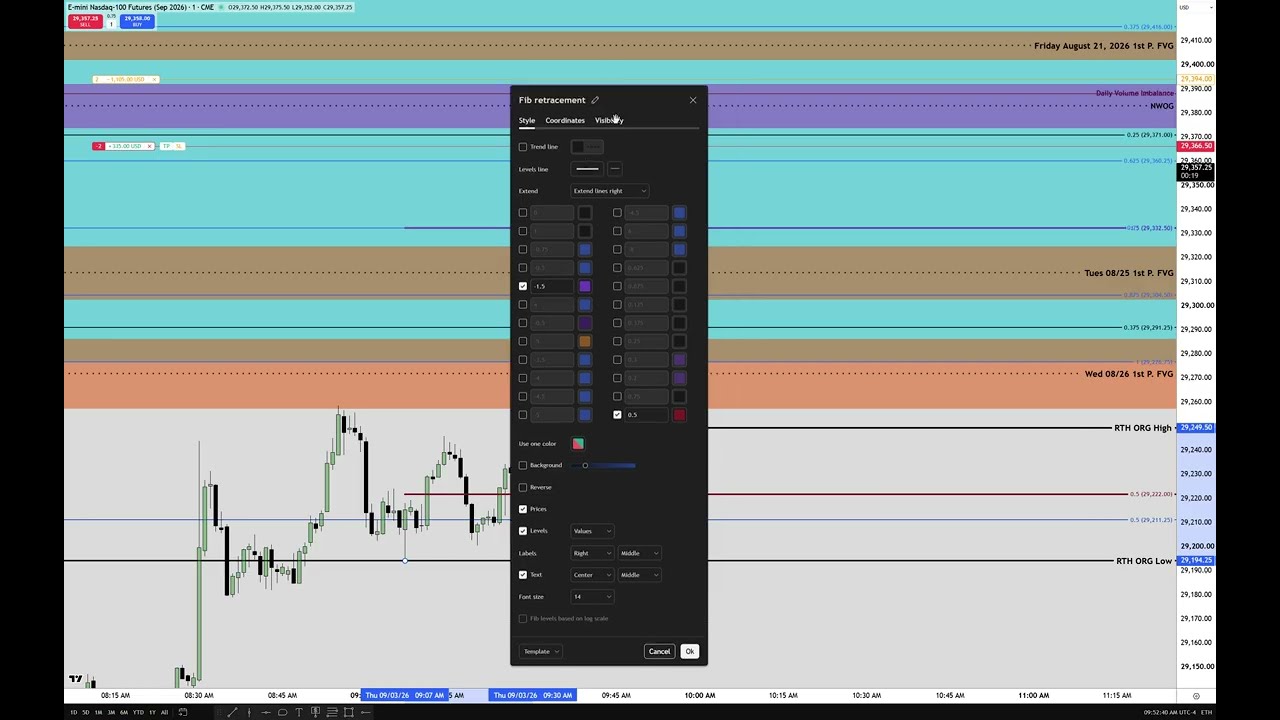
    – Chart annotations and precision: Annotate pre‑market (7–9 ET) highs/lows, draw Fibs, mark relative equal highs/lows, opening range (9:30–10:00) and opening‑range gaps (RTH close to next open). Use exact prices (price notes), enlarge fonts, and fill empty chart real estate with detailed observations.

    – Opening‑range gaps and projections: Classify gaps as discount/premium (open vs prior RTH close). Use mid‑gap/consequent encroachment and Fib negative‑1 projections to identify likely intraday targets and extremes.

    – The “silver bullet” — 10:00 hour and First‑Presented Fair Value Gap (FPFVG): Mark 10:00 and identify the first presented FVG and whether it has displacement. Combine FPFVG, 10:00 low (lunch macro), relative equal highs/lows and other context to create high‑probability narratives for entries, realistic stops (e.g., last outside candle high +1 tick), partials and risk sizing.

    – Mindset and journaling: Keep notes positive and constructive to build confidence. Treat your journal as private training material that creates “pseudo‑experience” and shortens the learning curve. Record losing days constructively.

    – Final points: Be consistent — backtesting and disciplined journaling are the paths to reading live price action. Don’t rely on black‑box tools or AI to replace human real‑time candlestick interpretation; practice will develop those skills.
  • NQ Futures Review & 1st Presented Reflection FVG

    NQ Futures Review & 1st Presented Reflection FVG

    https://www.youtube.com/watch?v=9W4YpyAg5RY

    Summary:

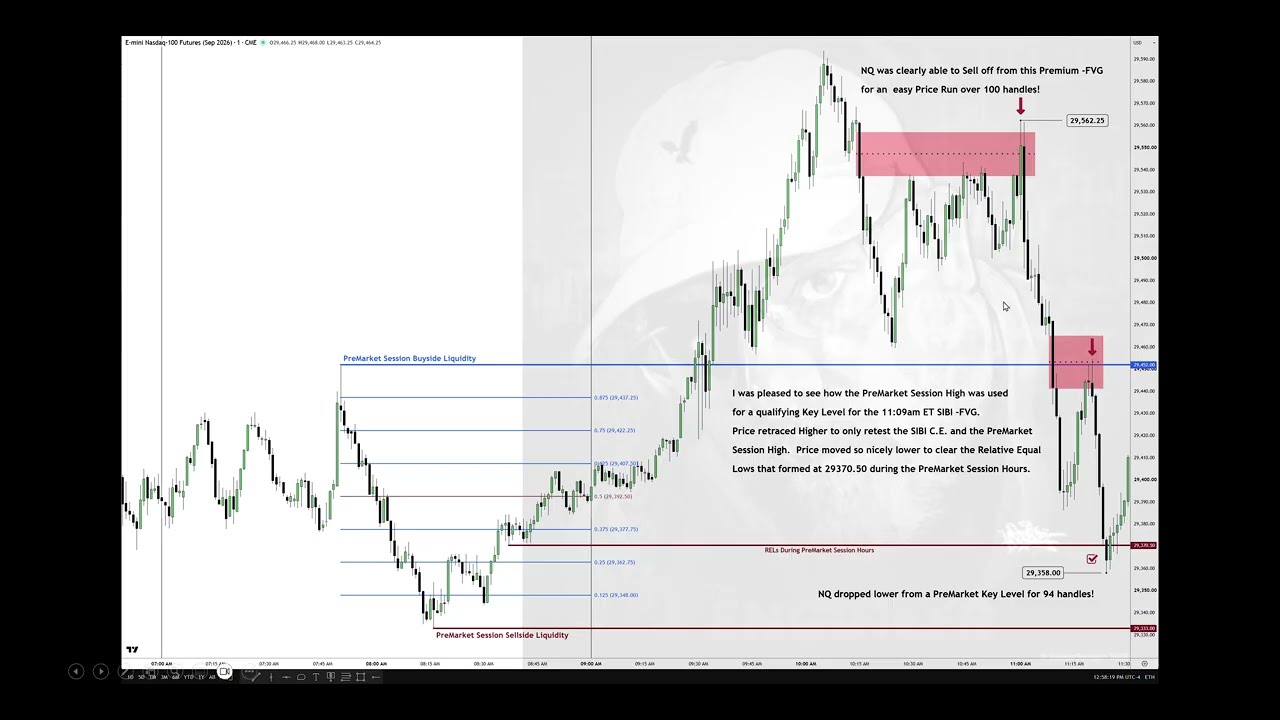
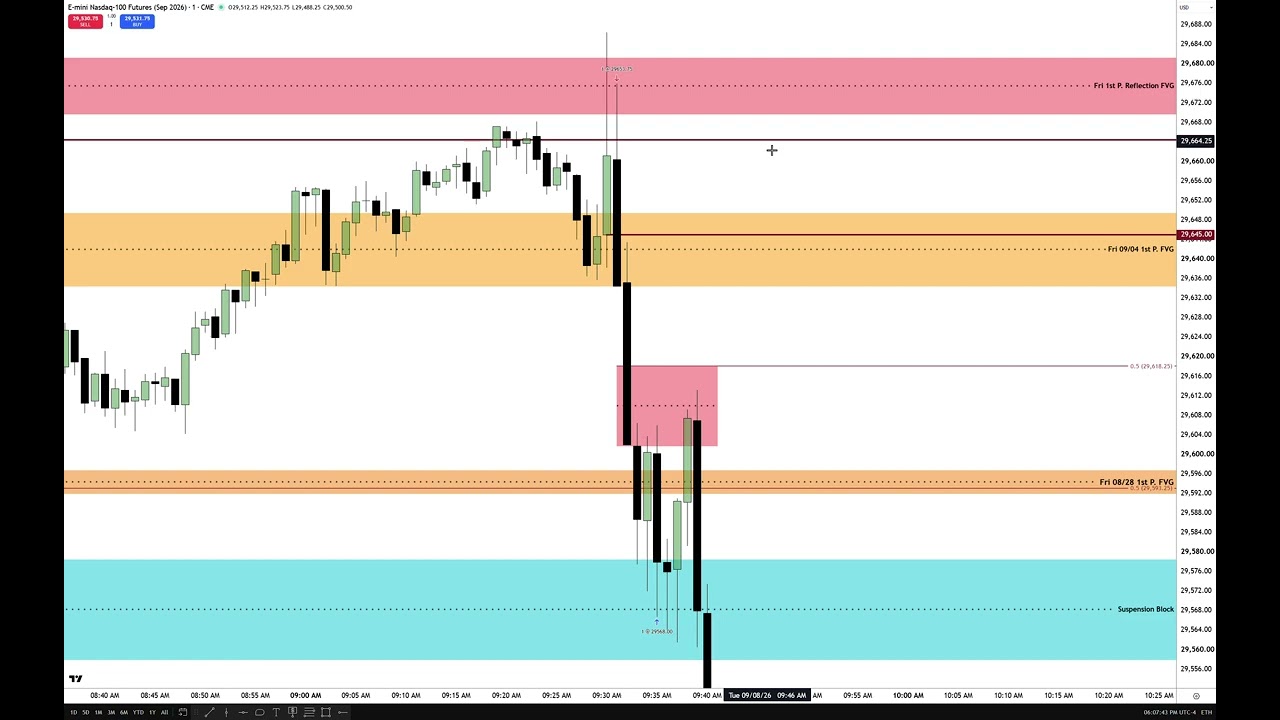
    The speaker reviews recent price action and explains three related PD arrays (PDAs): the first presented fair value gap (FVG), the first presented FVG with displacement (more significant because it clears a prior high/low), and the reflection FVG (the first opposite-characteristic gap after the initial FVG). Key practical rules: focus on the first opposing characteristic that forms after the 9:30 Eastern open, give greater weight to FVGs with displacement, and treat the reflection FVG as a mirror/opposite of the first presented FVG.

    Using examples from last Friday through this morning, the speaker shows how these levels (extended to the right) and midpoints of wicks guide entries, stops, and targets. Important tactical points: bodies closing in the lower half of a gap signal weakness; wicks and midpoint behavior are meaningful; use pre-market (7–9 a.m.) and London session levels as context; and prefer “low-hanging fruit” exits and smaller position sizing immediately after holidays because volume and behavior can be unpredictable.

    Teaching/philosophy: this method is detailed and requires independent study—keep notes, topical journals, and do due diligence. The presenter emphasizes disciplined application over simplicity and warns that critical or lazy commentary will be muted.

  • How To Engage Price After Holiday Volume Days

    How To Engage Price After Holiday Volume Days

    https://www.youtube.com/watch?v=VBgfJRMVCaI

    – Market opened after the holiday with a roughly 100-handle premium gap (fair value gap from prior Friday). The trader watched for fills to key levels: half-gap, suspension block (sell-side liquidity), and volume-imbalance/CBI zones.
    – Trading approach: start light after a holiday (one contract, paper trading) to get a feel for price action and avoid forcing trades when volume and behavior can be wonky.
    – Execution rules highlighted: place stops just above wick highs (or above the second wick high), target sell-side areas inside wicks and volume imbalances, and take partial profits when new lows form.
    – Observations: NASDAQ showed relative weakness; price stayed in lower halves of key zones (premium sensitivity), which signaled likely further downside. The market filled half the gap then sold off and ultimately took out recent lows.
    – Reviewed recent context: referenced last Friday’s fair value gap, new-week opening gaps, and an Asia session CL example where an entry near 595.25 briefly went against the trader before rallying—illustrating use of gaps and stops.
    – Key teaching point: after holidays trade light to align with price action, use gap/CBI/volume-balance rules, protect risk with stop placement, and take partials to lock in gains rather than wait for a single terminal profit.
    – Closing: recording to be posted for teaching; overall session validated the stated rules and approach.

  • NFP Review & New Student Encouragement

    NFP Review & New Student Encouragement

    https://www.youtube.com/watch?v=-Qag-99u_BM

    Summary:

    – Topic: NASDAQ review of Friday’s nonfarm payroll (NFP) action and a short lesson on the instructor’s “TGIF” trading concept.
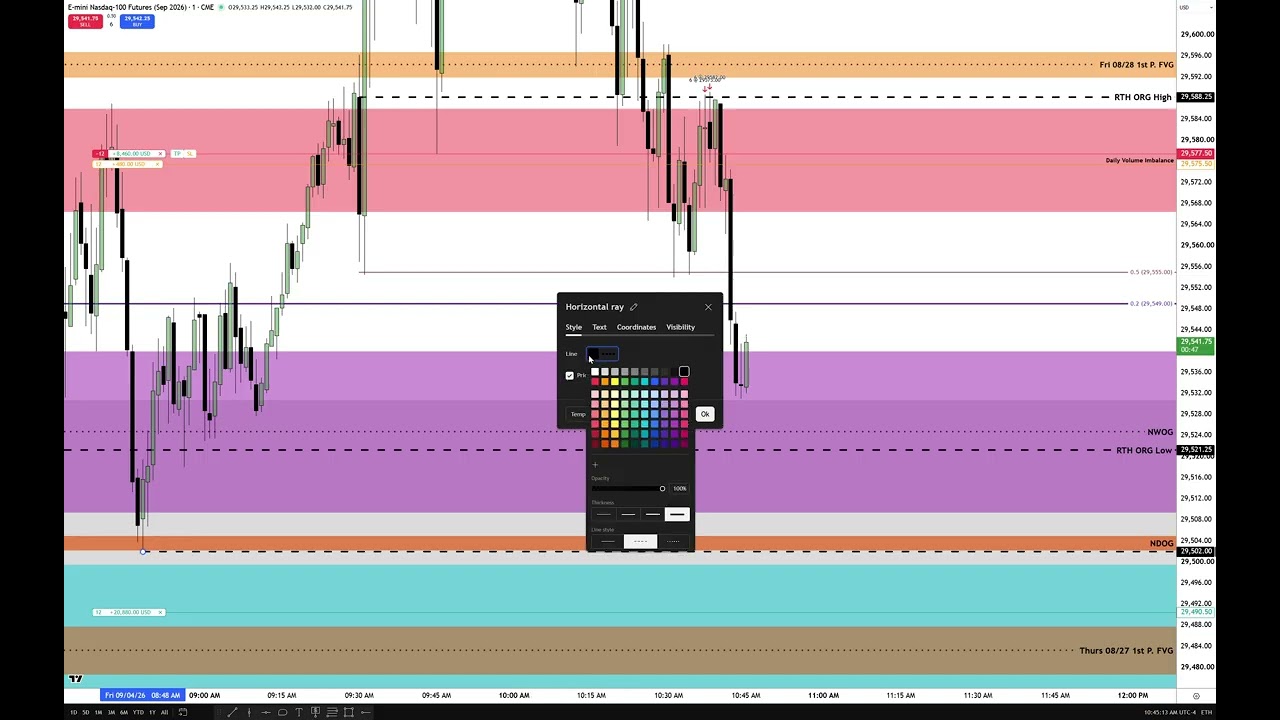
    – TGIF concept: measure the weekly range (low→high) and expect a 20–30% retracement after a large or one-directional week. These retracements often show up late Thursday or during Friday and can be anticipated using Fibonacci levels (he noted 20% ≈ 29,549 and 30% ≈ 29,471.25 for the week reviewed).
    – Price structure and execution: on NFP the wicks rallied above short-term highs but candle bodies did not close above them; fair value gaps, the new-week opening gap (Thursday close → Friday open), and the “lunch macro” (around 11:30 ET, looking left to the 10:00 hour high) were important reference points. He abstained from aggressive shorting because of NFP/long-weekend risk, manually closed a short to avoid a stop-out, and the market later retraced down to his target (including the 20–30% weekly retracement and Thursday’s first fair value gap).
    – Teaching and philosophy: he emphasizes that price action is not random, promotes his PD-array framework and rules-based process, and urges students to keep records, build charts that track key gaps/levels, and learn independence rather than copying trades.
    – Personal/ethical points: defends his free teaching, responds to critics, stresses discipline over chasing money, and encourages generosity and using success to help others.

  • How New Students Should Start Part 4 \ Pillars Of Daily Log Entries

    How New Students Should Start Part 4 \ Pillars Of Daily Log Entries

    https://www.youtube.com/watch?v=L81eMQhmXmc

    This video gives a simple, practical six‑week routine for new students to build pattern recognition in price action by daily logging three repeatable phenomena. Key points:

    Purpose and approach
    – Don’t try to learn everything at once. Focus on a few repeatable tasks, build habit and sample size, then backtest later.
    – Spend ~20 minutes/day, take screenshots and annotate neatly. Keep electronic notes if possible. Study past ~6 weeks and continue forward to build a 12‑week sample (start with NASDAQ if unsure).

    Three daily pillars (use 1‑minute charts)
    1) Pre‑market phase (7:00–9:00 AM ET)
    – Draw vertical lines at 7:00 and 9:00, record the highest high, lowest low, and any relative equal highs/lows.
    – Note whether price is trending or consolidating in that window; this often foreshadows behavior after the 9:30 RTH open.

    2) Regular Trading Hours (RTH) opening‑range gap
    – Toggle RTH on the chart, draw a rectangle from prior close (4:14 PM ET) to the new open (9:30 AM).
    – Use the rectangle’s midpoint (inefficiency) and log if/when price encroaches it (often by ~10:00 AM). Track how often and how price reacts.

    3) First fair value gap after 10:00 AM ET
    – On the 1‑minute chart, identify the first fair value gap that forms at/after 10:00 AM, extend and log when price returns to it and the subsequent move.
    – Record times, ranges (handles), and outcomes.

    Execution and mindset
    – Start with one pillar for two weeks, add a second for weeks 3–4, then the third for weeks 5–6. Consistent daily logging builds recognition, discipline, and confidence—avoid system‑hopping. Review screenshots on non‑trading days to catch missed details.

  • How New Students Should Start Part 4 \ Pillars Of Daily Log Entries

    How New Students Should Start Part 4 \ Pillars Of Daily Log Entries

    https://www.youtube.com/watch?v=L81eMQhmXmc

    This video gives a simple, practical six‑week routine for new students to build pattern recognition in price action by daily logging three repeatable phenomena. Key points:

    Purpose and approach
    – Don’t try to learn everything at once. Focus on a few repeatable tasks, build habit and sample size, then backtest later.
    – Spend ~20 minutes/day, take screenshots and annotate neatly. Keep electronic notes if possible. Study past ~6 weeks and continue forward to build a 12‑week sample (start with NASDAQ if unsure).

    Three daily pillars (use 1‑minute charts)
    1) Pre‑market phase (7:00–9:00 AM ET)
    – Draw vertical lines at 7:00 and 9:00, record the highest high, lowest low, and any relative equal highs/lows.
    – Note whether price is trending or consolidating in that window; this often foreshadows behavior after the 9:30 RTH open.

    2) Regular Trading Hours (RTH) opening‑range gap
    – Toggle RTH on the chart, draw a rectangle from prior close (4:14 PM ET) to the new open (9:30 AM).
    – Use the rectangle’s midpoint (inefficiency) and log if/when price encroaches it (often by ~10:00 AM). Track how often and how price reacts.

    3) First fair value gap after 10:00 AM ET
    – On the 1‑minute chart, identify the first fair value gap that forms at/after 10:00 AM, extend and log when price returns to it and the subsequent move.
    – Record times, ranges (handles), and outcomes.

    Execution and mindset
    – Start with one pillar for two weeks, add a second for weeks 3–4, then the third for weeks 5–6. Consistent daily logging builds recognition, discipline, and confidence—avoid system‑hopping. Review screenshots on non‑trading days to catch missed details.

  • My Model On NQ NFP Friday

    My Model On NQ NFP Friday

    A live trading commentary where the speaker narrates a short intraday short trade and explains the thinking, strategy, and risk management. Key points:

    – Market context: price traded into the day’s opening-range-gap high (9:30 open), which coincided with a daily buy-efficiency/volume area. The trader expected a sharp sell-off to take out the regular trading-hours opening-range gap low and the nonfarm-payroll (NFP) liquidity cluster just below ~29,500, aiming for about a 30% weekly-range retracement (~29,471).
    – Strategy/model: trading the “market maker” model — favoring second-stage distribution/redistribution sell setups (and second-stage reaccumulation for buys). References earlier mentorship material and chart models he teaches.
    – Execution and risk management: he positioned short, moved his stop down to lock profit as levels were met, took partial profits, and closed the remainder before his planned stop when action looked likely to hit it. Emphasizes being willing to be stopped out and not risking unrealized gains.
    – Trading tips and opinions: warns against using market replay for teaching (calls it a crutch), advises caution trading late in NFP weeks (avoid after 11:00 AM Wednesday ET), and highlights watching liquidity clusters, gap lows/highs, and volume imbalances.
    – Tone/closure: casual, humorous, and personal — he jokes about chart “gimmicks,” teases a planned lecture, and signs off for a four-day Labor Day weekend.

    Overall: a practical day-trade recap combining technical levels, a market-maker framework, disciplined stop/profit management, and behavioral advice about NFP-week risks.

  • Trading NFP Thursday High Resistance Liquidity Runs

    Trading NFP Thursday High Resistance Liquidity Runs

    https://www.youtube.com/watch?v=xpH0wDANtmM

    The speaker is taking a short trade, aiming for the new-week opening-gap low and other prior fair-value-gap targets, because he believes recent 8:30 employment data are manipulated and will push price lower. Entry plan: short near the intraday/high of the gap, place the stop just above that gap high, and validate the trade if price closes below a key inversion fair-value-gap level (29,292.25). He monitors behavior of candles (no bodies in the upper half of inefficiencies) and opening-range gaps to confirm weakness, lowers the stop to ~29,340 once confirmation occurs, and takes partial profits (reducing from three contracts to leave a runner) while managing expectations and risk. He stresses this is guided by a market-maker sell-model (first-stage distribution → second-stage redistribution), not guesswork, and notes he usually avoids trading late in non‑farm‑payroll weeks because of heavy manipulation but made an exception to demonstrate his rules. Overall: a disciplined short with clear stop, staged profit-taking, and reliance on specific price-structure rules.

  • How New Students Should Start Part 3

    How New Students Should Start Part 3

    Summary — key ideas and practical steps

    – Main message: Be a disciplined manager of information. Don’t overload charts with gimmicks (heatmaps, liquidity maps). Use a simple, repeatable regimen to get the high-value reference points that actually drive price moves.

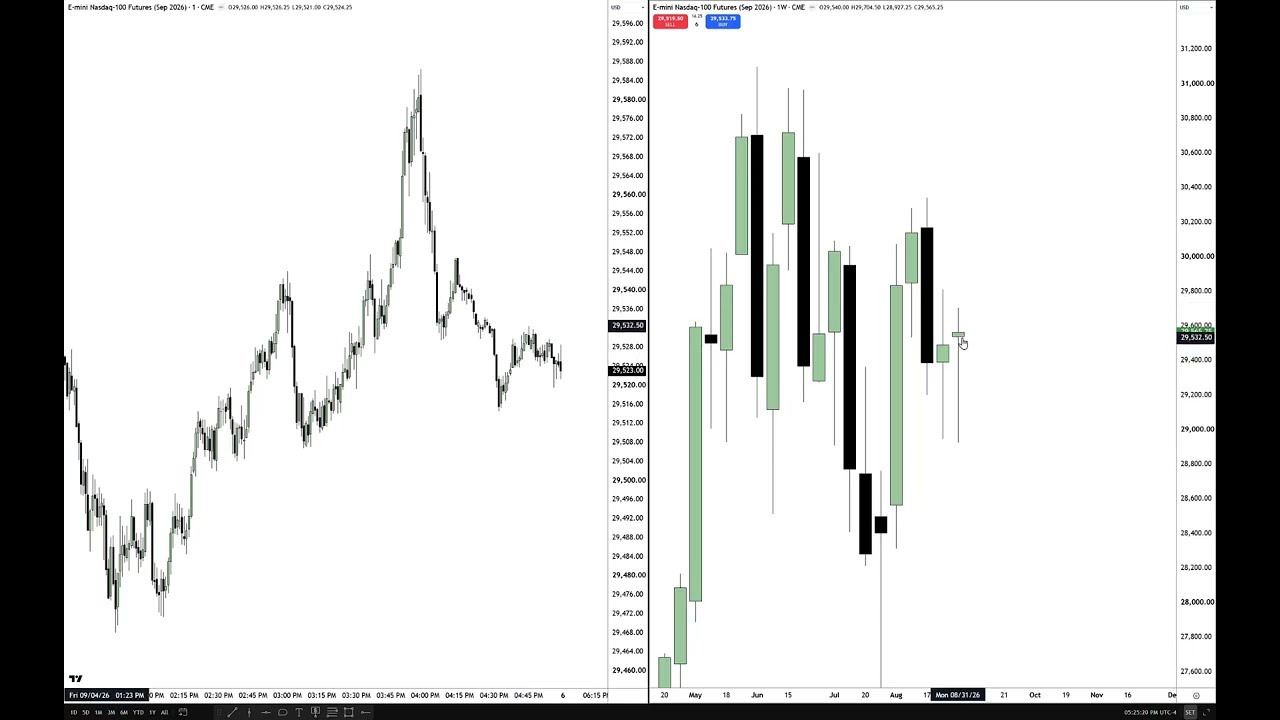
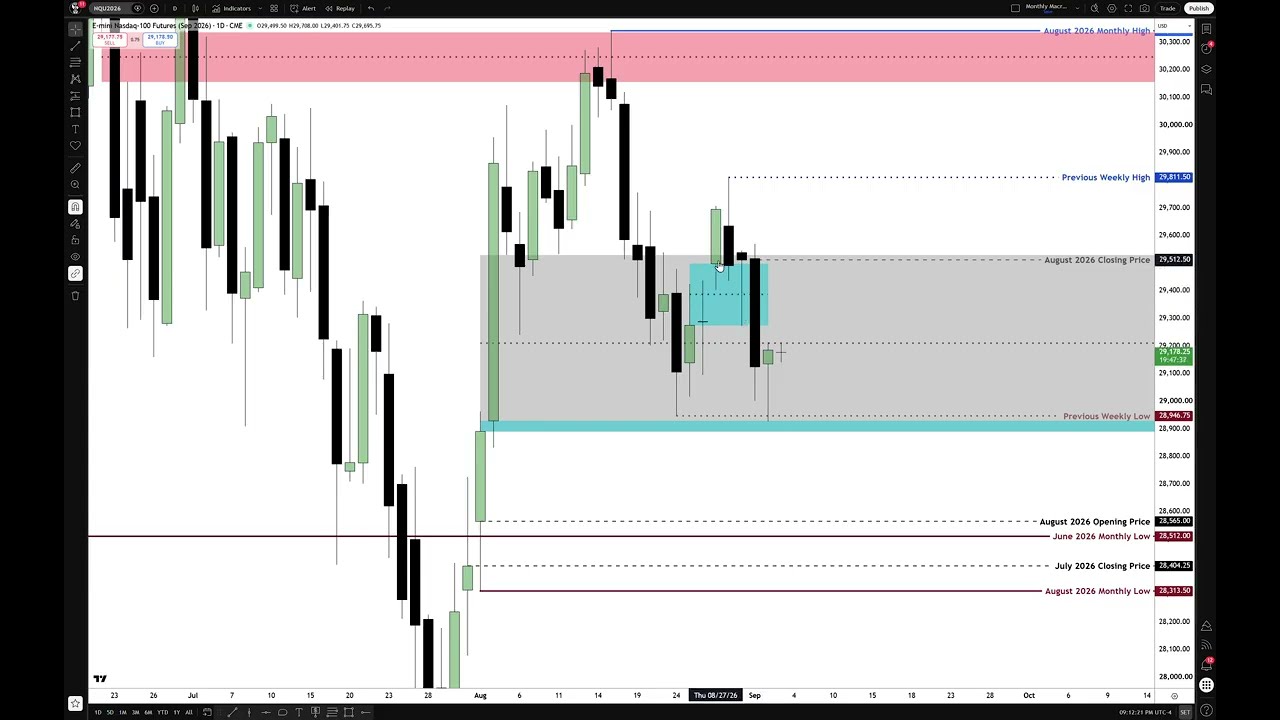
    – Macro first: Build clean higher‑timeframe workspaces. On a monthly chart mark the last three months’ open, high, low, close (HLOC). These give macro premium/discount context and seasonal/quarterly perspective.

    – Weekly and daily follow-up: Add previous week’s high and low, then use the weekly and daily charts to refine where price sits within those ranges (above 50% = premium, below = discount).

    – Create separate layouts (workspaces) for specific purposes so each chart only shows the information you need (monthly macro keys, new‑week opening gap matrix, RTH opening-range gap matrix, first‑presented fair value gaps, etc.).

    – New‑week / new‑day gaps and RTH opening‑range gaps: Track at least the last five weekly opening gaps (Sunday 6:00 pm ET vs Friday close) and maintain matrices for first fair‑value gaps and regular trading hours opening‑range gaps. Grade those ranges and use octants/quadrants to anticipate where price will react.

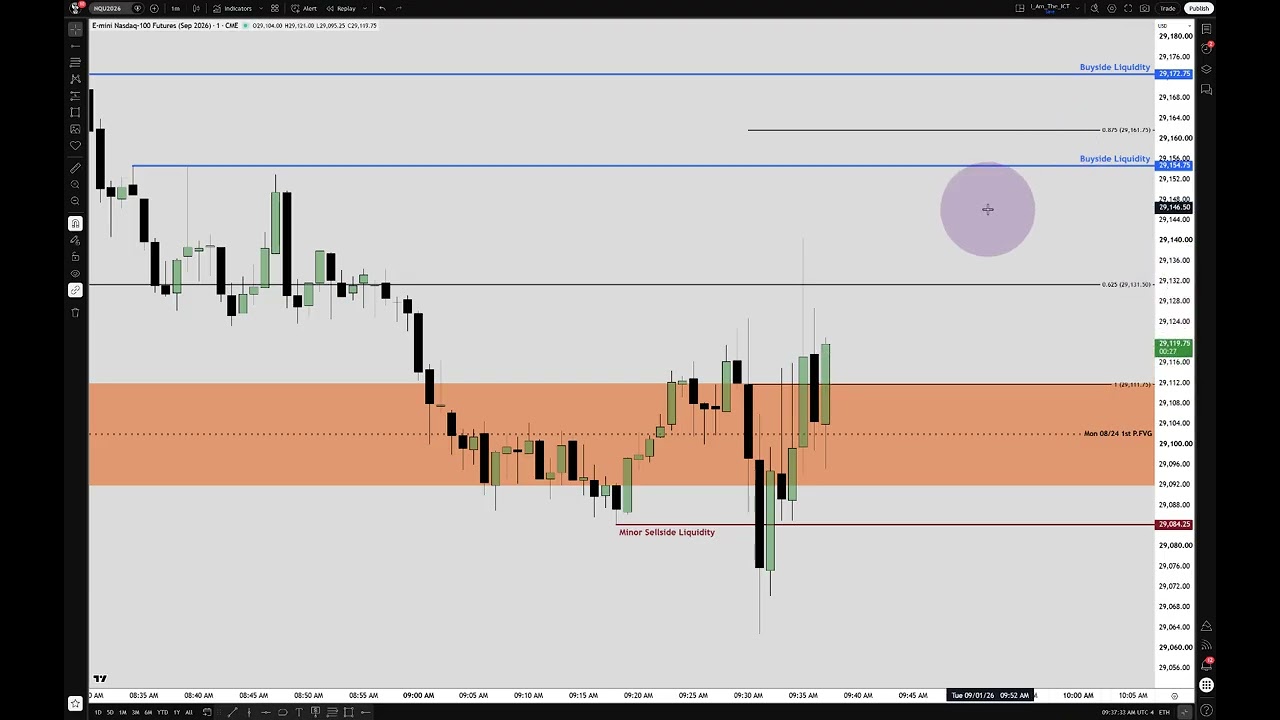
    – Volume imbalances / fair‑value gaps: Shade inefficiencies (volume imbalance, fair‑value gaps) on higher timeframes and transpose those levels down to lower timeframes (e.g., 1‑minute) to find precise intraday reactions and trade locations.

    – Time matters: Seasonality and event timing matter (example: September often weak; NFP week — new traders should mostly stop trading by ~11:00 am ET Wednesday). Time + price + graded ranges = clarity.

    – Workflow advice: Annotate levels to study and journal, then clear overlays to keep working charts clean. If you can’t follow this simple, structured approach, you’ll struggle — the method requires discipline and consistent data management.

    – Applicability: The framework works for swing, position, intraday, and scalping styles — it’s a coherent system for locating probable price moves rather than guessing with cluttered indicators.

    Bottom line: simplify your charts, collect and manage a few reliable HTF reference points (monthly HLOC, previous weekly H/L, NWG/NOG/RTH gap matrices, graded ranges/volume imbalances), transpose them to lower timeframes, and use time + price context to trade more deliberately.

  • How New Students Should Start Part 2

    How New Students Should Start Part 2

    Summary:

    – Context: Live morning trading session/lecture analyzing a large overnight sell-off and a big regular-hours opening-range gap (9:30 ET). The presenter blends higher-timeframe daily structure (buy/sell-side balance, fair value gaps) with intraday opening-range levels to form a trading plan.

    – Market view and plan: Because of the large opening gap and where daily levels lined up, the bias was to favor longs into the gap rather than shorting. Key target level repeatedly referenced was ~29,212 (a confluence of opening-range fibs and a daily buy-side efficiency). The plan included looking for sweeps of highs to engineer sell-side liquidity, then re-accumulation and runs into buy-side liquidity pools.

    – Trade management and rules emphasized: small, disciplined position sizing; clear entries, stops and partial profit-taking; trailing stops as price proved itself; accept small stop-outs as part of the process; be nimble in consolidation; write trade notes. Concepts used: first-presented fair value gaps, inversion fair value gap, institutional orderflow cues, and the “dead pull” technique to get price moving.

    – Execution highlights: Multiple hypothetical and real trades taken (mainly long), stops adjusted to breakeven/cost-coverage as positions progressed. One losing trade (small stop hit), multiple partials taken. Stop levels mentioned roughly in the 29,100–29,170 area depending on leg. News around 10:00 and the 10:30 one-hour dealing range were noted as important inflection points.

    – Outcome and teaching points: Despite a challenging, choppy morning, the session ended positive — roughly 125–130 handles net (after a small losing trade and several partials). Emphasis throughout was on tape-reading, patience, using higher-timeframe confluence to bias intraday trades, accepting losses, and teaching beginners to record and learn from each trade rather than chase demo perfection.

    – Tone: A conversational, instructional livestream aimed at students—mixing technical analysis with practical tradecraft and real-time decision commentary.