Tag: 2026

  • Trader Round Up – ICT follow through | March 08, 2026

    Summary:

    In a live trading Twitter/X space, host Kitt moderates a discussion with Michael Huddleston (ICT) and global participants, stressing adherence to a speaker “process” and keeping commentary focused on markets rather than geopolitics. Traders share takeaways from ICT’s weekly review, including relative strength/SMT analysis on indices using line charts, expectations around gaps (indices gap down, metals/oil move), and assignment research (Hunt Brothers). Several off-topic or unprepared speakers are cut short, while others ask about fair value gap fills, macro timing precision (e.g., 10:50–11:10), managing opening-range/RTH gap levels (keep last five in rotation), and CFD vs futures. The group emphasizes journaling to reveal psychological errors and recommends healing fear by stepping back to tape-reading and demo. ICT proposes a four-week “one micro” challenge to earn about $1,000 to cover key bills, focusing on discipline, small risk, and scalability.

    Quiz:

    How well were you listening? Test your knowledge

    According to ICT, what is the most important central factor that drives how and why prices move?
    a) Volume
    b) Indicators
    c) Time
    d) News events

    Answer: c) Time
    Evidence (00:51:10): “The most important central tenant to how and why prices move… it’s time.”

    How many opening ranges does ICT recommend keeping on the chart as a general rule of thumb when analyzing price?
    a) 3
    b) 5
    c) 10
    d) 20

    Answer: b) 5
    Evidence (00:37:55): “I gave, as a general rule of thumb, keep five on there.”

    When mapping multiple opening ranges, what does ICT suggest using to define the complete price range or grid?
    a) The most recent opening range only
    b) The highest high and lowest low of the last five opening ranges
    c) The daily open and close
    d) The weekly high and low

    Answer: b) The highest high and lowest low of the last five opening ranges
    Evidence (00:38:00 – 00:40:00): ICT explains using “the highest high of that range and the lowest low of the five” to create a complete range or grid.

    What does ICT say macro time windows are primarily used for in trading?
    a) Determining stop-loss levels
    b) Predicting news releases
    c) Focusing attention on when price moves tend to start or end
    d) Identifying market manipulation

    Answer: c) Focusing attention on when price moves tend to start or end
    Evidence (00:42:00): “The macro is not the answer to everything. It’s a timing mechanism… a window of time where things tend to happen.”

    In ICT methodology, what is the purpose of identifying liquidity in the market?
    a. To determine broker spreads
    b. To find price levels the market may target next
    c. To calculate lot size
    d. To determine leverage

    Answer: b. To find price levels the market may target next

    Timestamp: 00:40:26
    Text: “It’s gonna reach for a pool of liquidity that’s within striking distance…”

    What concept helps traders determine whether price is relatively “cheap” or “expensive” within a range?
    a. Market profile
    b. Premium and Discount
    c. Fibonacci expansion
    d. VWAP

    Answer: b. Premium and Discount

    Timestamp: 00:40:14
    Text: “Assuming that we’re in the lower 100 handles of that 350, are we in a discount or a premium relative to that?”

    When analyzing a trading range, what additional factor does ICT say traders should combine with price location?
    a. Volume indicators
    b. Fibonacci levels
    c. Time aspect
    d. RSI divergence

    Answer: c. Time aspect

    Timestamp: ~00:39–00:40 discussion
    Text: “Where are you at with market price? Then add the time aspect to it and you’ll be able to see where you’re at in that range.”

    Which price imbalance concept is mentioned as a possible continuation entry signal?
    a. Breaker Block
    b. Fair Value Gap
    c. Volume Gap
    d. Stop Cluster

    Answer: b. Fair Value Gap

    Timestamp: 00:43:00
    Text: “I’ll just look for a continuation institutional order flow entry drill, or another fair value gap.”

    Which ICT concept is referenced as a way to study how institutional price movements originate?
    a. Breaker theory
    b. Liquidity sweep model
    c. Order Block projection theory
    d. Volume imbalance model

    Answer: c. Order Block projection theory

    Timestamp: 00:32:29
    Text: “Order block projection theory, very clearly articulated by Michael…”
  • Feburary 13, 2026 | Trader Round Up – It’s Friday

    Summary:

    A live conversation where speakers discuss concerns about food and health, claiming “fake meat” is being pushed while alleging mRNA is being injected into meat and that cancer “cures” will be delivered by syringe. One speaker recommends halal meat for cleanliness but says it would not remove mRNA, describes being “pure blood,” and recounts a childhood vaccination event involving his youngest child’s blood pressure crash and later learning differences. He criticizes chemotherapy as ineffective, suggests nutrition changes (especially removing carbs and sugar) could have helped his grandfather with pancreatic cancer, and mentions fenbendazole and ivermectin as potential aids.

    The group emphasizes buying food directly from farms, promoting paleo-ketogenic, high-fat/high-protein diets (raw butter, organ meats), and avoiding processed foods; they cite widespread antibiotic use in livestock and contamination of grains/beans with pesticides and glyphosate, and discuss fluoride, aluminum, and geoengineering as harmful.

    The conversation shifts to politics and conspiracy topics, including Epstein-related documents, allegations of “disclosure, missing government trillions, and claims of a “Luciferian” power structure. Speakers speculate about engineered civil unrest (“zombie apocalypse” as code), false-flag events, depopulation, and government preparation (food storage, officials’ security measures). They argue the system is designed to push people toward snapping while remaining comfortable enough not to act.

    Later, they return to personal health practices: elimination diets, cutting sugar and bread, improved resting heart rate and blood pressure, and discussion of parasites and turmeric for inflammation.

    A major emotional segment features a participant thanking Michael for his “Berean Study” YouTube channel, describing how it led him to church and baptism in Jesus Christ’s name, and sharing that the experience felt more liberating than money or trading success. Michael responds that the testimony answers his doubts about reaching people, says he would rather focus on Bible teaching than trading, and gives advice on faith: read the Bible (he mentions reading it through with Alexander Scorby), talk to God openly, place God above all else, and live with daily gratitude and praise. Other participants affirm the impact of Michael’s beliefs and teaching across different religious backgrounds.

  • ICT 2026 Smart Money Concepts Lecture \ January 02, 2026

    ICT 2026 Smart Money Concepts Lecture \ January 02, 2026

    https://www.youtube.com/watch?v=1X0A-Lgf9RY

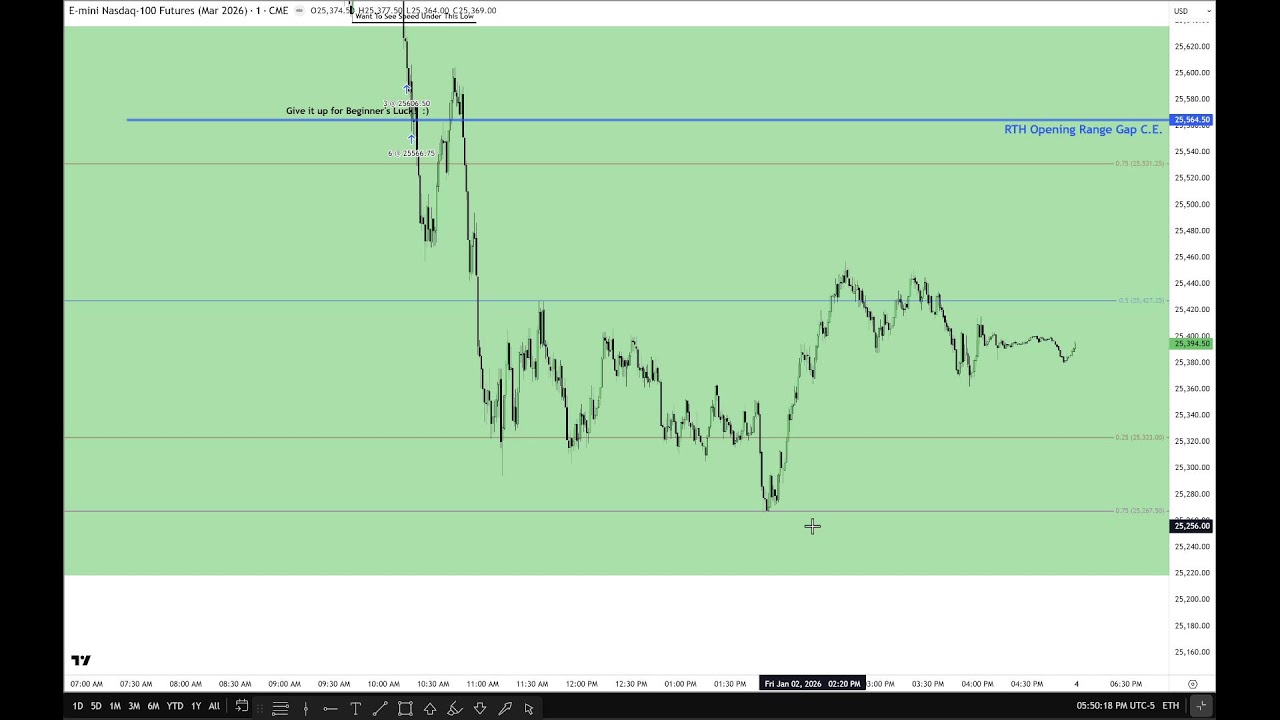
    Michael reviews a live Friday trade to demonstrate the concepts from his previous lesson. He describes using the daily chart’s suspension block, volume imbalances, and wick-based quadrant levels to establish a bearish bias, then looking on lower timeframes for a liquidity sweep and breakdown. He says he prioritizes inefficiencies on the buy side of a swing high and uses the opening-range gap’s midpoint as a practical target.

    He also emphasizes taking partial profits near targets, adjusting stops as price moves in your favor, journaling trades, and practicing on historical data to build independent judgment. He encourages patience and consistent study, while noting that other tools may help some traders but are not essential to his approach.

  • ICT Opening Range Theory \ 1st Presented FVG Logic

    ICT Opening Range Theory \ 1st Presented FVG Logic

    https://www.youtube.com/watch?v=Zm9Q0NDRxoY

    – The speaker returns after travel (road trips up/down the U.S.), is a bit sick, and gives a focused December NASDAQ mini futures review for Nov 11—brief because of limited time/energy and upcoming teaching sessions with his sons.
    – Market read: price has respected higher‑timeframe weekly/daily volume imbalances, fair value gaps (FVGs), and order blocks; recent action shows a bullish bias as price reclaimed imbalance areas but stalled at upper bounds.
    – Methodology emphasized: read price from higher to lower timeframes, measure PD arrays by premium/discount sensitivity and “consequent encroachment,” and use those zones to define bias (defend upper half = bullish; defend lower half = bearish).
    – Practical rules highlighted: use 30‑minute opening ranges (not 15‑minute) to identify displacement and the first‑presented fair value gap—especially for the London open (1:30–2:00 AM ET) and equity open (9:30–10:00 AM ET); New York “kill zone” is treated differently (7:00–9/10:00 AM ET) because it covers many instruments.
    – Trade setups: look for engineered liquidity, false breakouts (his “turtle soup” concept), inversion FVGs after buy/sell liquidity raids, and time‑based, rule‑driven occurrences that algorithms reliably reproduce.
    – Practical advice and tone: study the longer, detailed content rather than short clips, follow the specific rules he teaches, manage risk/take profits (he points to prior warnings on ENQ, Bitcoin, gold), and remember these setups are probabilistic, not perfect.
    – He reiterates ownership of these methods, frustration with misrepresentations by others, and that his aim is to protect traders and teach durable, repeatable rules.

  • ICT NQ Futures Market Review \ October 1, 2025

    ICT NQ Futures Market Review \ October 1, 2025

    https://www.youtube.com/watch?v=N4gTPOnZIYw

    The speaker reviewed a livestream added to the 2025 mentorship playlist that analyzed intraday price action using smart-money concepts (opening-range gaps, premium/discount wicks, quadrants, and fair-value gaps). He walked through chart cleanup and specific gradient levels, explained how sell-side liquidity and consequent encroachment/inversion fair-value gaps drove the move, and showed how those confluences acted as more reliable reference points than simple retail support/resistance (using a London-low example). He stressed documenting PD arrays and major fair-value gaps, applying fib/gradient levels when appropriate, and studying past opening-range gaps and inefficiencies to improve precision. Practical advice: annotate charts thoroughly, practice patiently (treat it like meditation), don’t chase moves, wait for regular trading hours to see how gaps resolve, and avoid trading Forex right now (market looks poor).

  • Focus On Index Futures September 24, 2025 \ Intermediate Term High Continued

    Focus On Index Futures September 24, 2025 \ Intermediate Term High Continued

    https://www.youtube.com/watch?v=8DWi2wLWv30

    Summary:

    – Session focus: index futures (Christmas and QE mini) on Sept 24, 2025, using a daily chart and a 1-minute chart to analyze intraday structure.
    – Key structures discussed: premium wicks, quadrants, fair value gaps (FVGs), buy-side liquidity pools, breakers, order blocks, and measuring gaps. Price moved from a pre-market run-up and rejection into successive FVGs and sell-side structure, with several retracements and consolidations before close.
    – Important price events: pre-market buy-side liquidity was targeted, a high was rejected, price filled and tested bearish fair value gaps, broke lower through structure (bearish breaker and order block activity), then consolidated and oscillated around FVG/quadrant levels into the close.
    – Practical point: use gradient levels over premium/discount wicks and determine which wick to use by plotting candidate wicks on your own chart and watching which one price actually respects — there’s no automatic rule, it requires observation and judgment.
    – Takeaway: trade with the visible price structure (wicks, FVGs, quadrants, liquidity pools) and use hands-on verification to pick the relevant levels before the next move.

  • 2025 Storytellers Series – NQ Futures June 05, 2025

    2025 Storytellers Series – NQ Futures June 05, 2025

    https://www.youtube.com/watch?v=38-431ysWik

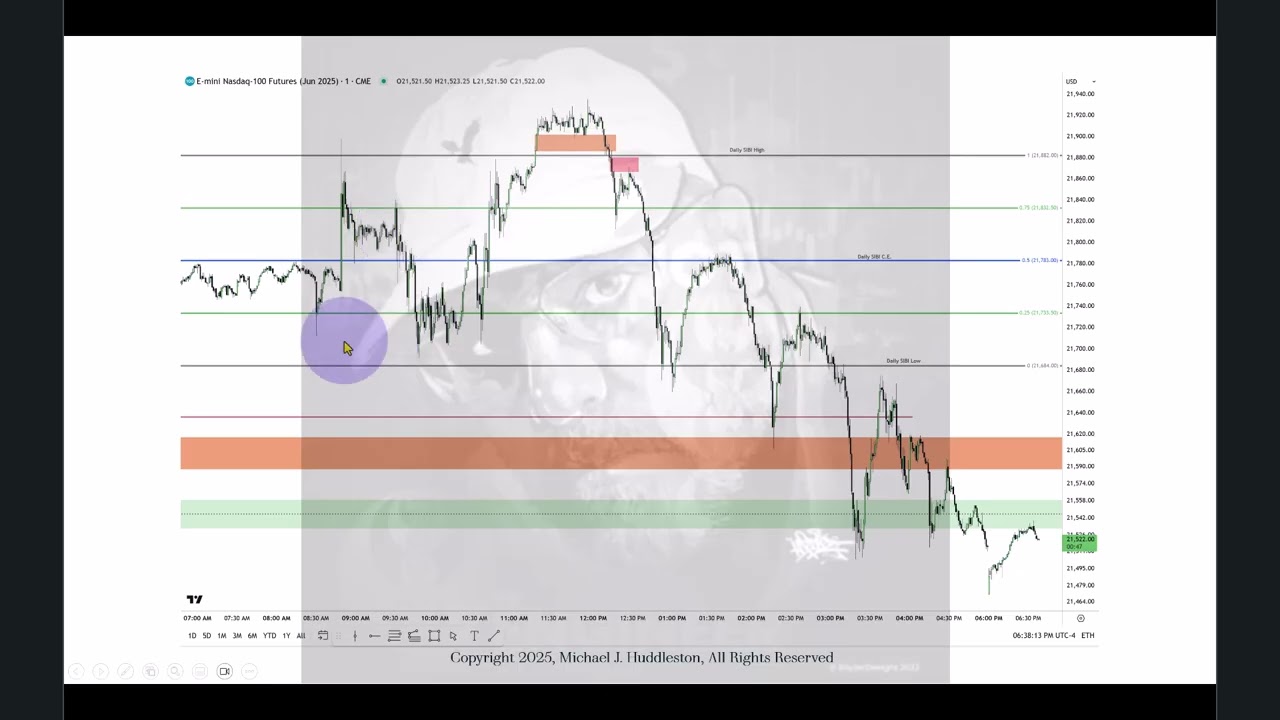
    – This is the Storyteller review for the June 5, 2025 NASDAQ futures contract, building on the June 4 video where key levels were posted.
    – ICT focused on a single concept: the daily “SIBI” (daily inefficiency / fair-value gap) and its graded levels (upper quadrant, consequent encroachment, lower quadrant, and low). Higher-timeframe inefficiencies are treated as real support/resistance.
    – Because it’s non-farm-payroll week, price was choppy and rangebound (especially Wed–Thu). New traders were advised to stop trading by about 7:00 AM ET ahead of the Friday release to avoid being caught in volatile, whipsaw action.
    – The intraday analysis used only the 1-minute chart and the daily inefficiency levels — no opening-range gaps, opening-gap tools, or new fair-value-gap techniques were used that day.
    – Practical trade notes: the presenter shorted near the London high into liquidity, watched price interact with the daily cibby levels (lower quadrant, order blocks, inversion fair-value gaps), took stops, and then followed further short/long opportunities as price cycled through those levels. The action showed classic NFP-week stop-hunts, liquidity grabs, and consolidations.
    – Main takeaway: knowing and trading around higher-timeframe inefficiencies within the context of the economic calendar simplifies entries and management; once price leaves the daily cibby, other reference points must be used. Study the one-minute chart and the prior video for details.

  • 2025 Storytellers Series – Dollar & EurUsd June 05, 2025

    2025 Storytellers Series – Dollar & EurUsd June 05, 2025

    https://www.youtube.com/watch?v=08d62cZDXUk

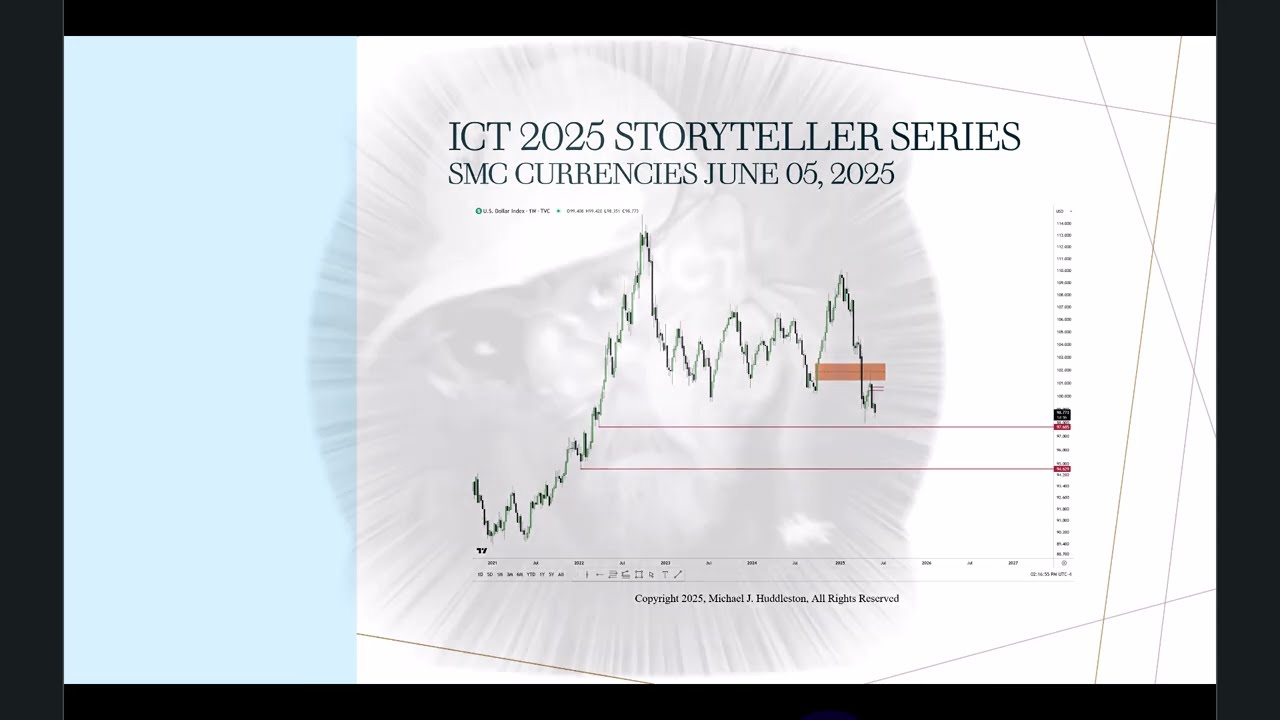
    – Context: Storytellers Series (episode 3), June 5, 2025 — focused on the dollar index and EUR/USD (not covering other FX pairs). The presenter is not actively trading Forex and treats it separately from his index-futures work.

    – Big-picture view: Global trade friction, tariffs and geopolitical risk are creating chaotic fundamentals. The presenter believes this environment is broadly negative for the U.S. dollar and that a softer dollar (higher EUR/USD) is the more likely outcome.

    – Market stance: Not bullish on the dollar index; expects lower dollar levels over time unless major geopolitical tensions unexpectedly resolve. He sees the broader market as risk-on (stocks can still rally), which supports a weaker dollar.

    – Technical approach: Analysis relies on technical constructs across timeframes—weekly, daily, hourly, 15-min, and 5-min—using concepts like fair value gaps, inversions, buy/sell-side efficiency, liquidity pools and order blocks. Key higher-timeframe sell-side liquidity and inversion gaps are focal points for downside targets.

    – Near-term triggers and risks: Employment and upcoming nonfarm payroll (NFP) data can change the picture; recent employment data caused short-term moves. Heavy manipulation and wide, unpredictable ranges are possible, making FX trading riskier now.

    – Practical cautions: He warns inexperienced or undercapitalized traders not to over-leverage or trade impulsively—profitability is difficult in the current FX climate. This commentary is opinion, not trading advice.

    – Frequency: He plans to post daily-ish EUR/USD and dollar-index updates when relevant, but remains cautious and will keep precise trade-levels private until warranted.

  • ICT Mentorship Core Content – Month 03 – Market Maker Trap Trendline Phantoms

    ICT Mentorship Core Content – Month 03 – Market Maker Trap Trendline Phantoms

    https://www.youtube.com/watch?v=o8NfSK-pUlE

    Summary:

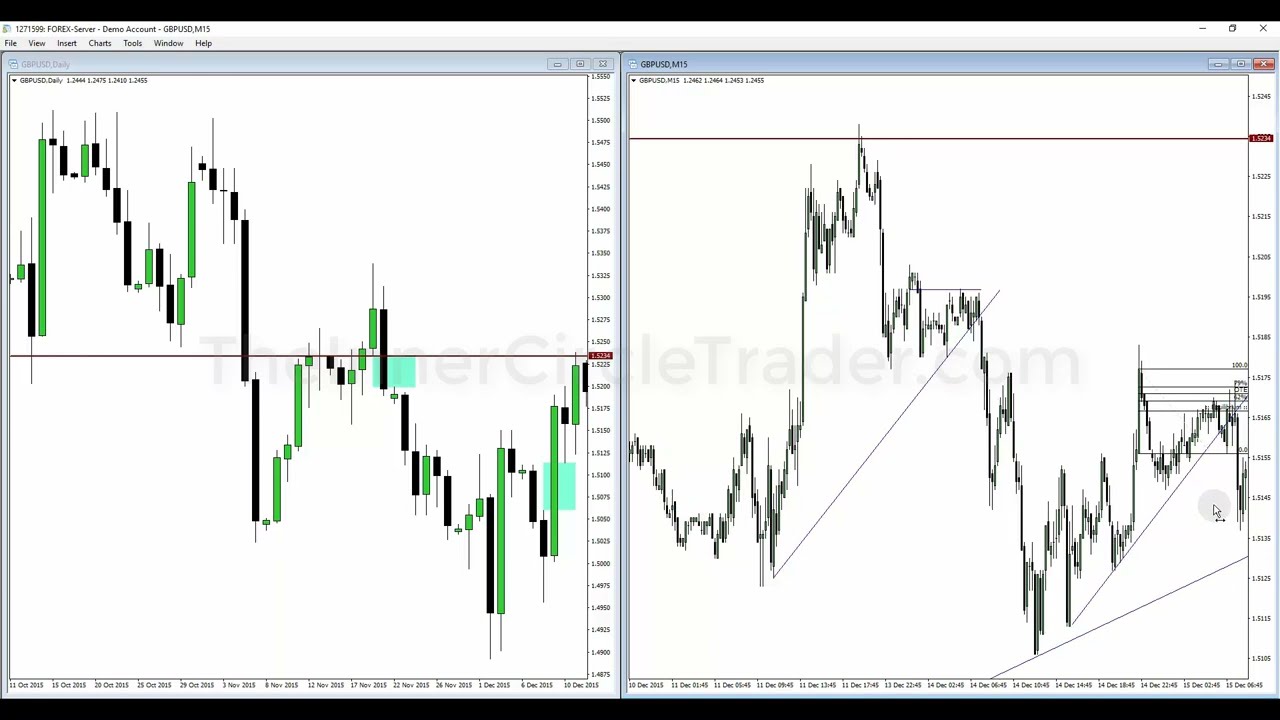
    – Topic: “Trendline phantoms” — diagonal trendline support/resistance as a common retail trading idea.
    – Claim: Diagonal trendline theory is subjective and offers no reliable statistical edge. Price does not “respect” lines drawn by traders; it moves where liquidity and institutional order flow are.
    – Mechanism: Retail traders adopt visible trendlines (higher highs/lows or lower highs/lows), creating predictable pools of stops and orders. Market makers and large funds exploit that liquidity, setting traps that cause retail buyers/sellers to be run over.
    – Practical implication: What looks like valid trendline support/resistance often becomes a false signal. Typical patterns:
    – Bullish trendline support can lure buyers who are then stopped out when price collapses to institutional levels.
    – Bearish trendline resistance can lure sellers who are subsequently short-squeezed upward.
    – The high/low between the 2nd and 3rd touches is often the area where smart money acts.
    – Trading approach recommended: Ignore diagonal trendlines as primary signals. Instead use higher-timeframe institutional reference points, order blocks, liquidity voids, equilibrium zones, and contrarian entries (breaker, turtle soup, order-block trades) to align with smart-money flow.
    – Conclusion: Trendlines are largely “phantoms” for retail. Study lower-timeframe action and institutional context to find where liquidity and smart money will actually move price, and trade against obvious retail trendline setups.

  • ICT Mentorship Core Content – Month 1 – Elements Of A Trade Setup

    ICT Mentorship Core Content – Month 1 – Elements Of A Trade Setup

    https://www.youtube.com/watch?v=0LhteuLVuDU

    Summary:

    – This is the first of eight ICT mentorship tutorials (September 2016) on the “elements of a trade setup.” It teaches how to build a repeatable trading framework by combining market context with institutional order-flow tools.
    – Two primary concerns: (1) the market context/condition and (2) specific institutional reference points (tools) to apply in that context.
    – Four market conditions (only one applies at a time): expansion (impulse/trend), retracement (pullback), reversal (change of direction), and consolidation (range/equilibrium).
    – Four ICT order-flow tools tied to those conditions: order blocks (paired with expansion), fair value gaps / liquidity voids (retracements), liquidity pools / stop runs (reversals), and equilibrium (consolidation).
    – Markets are largely driven by interbank/algorithmic price delivery. Price starts in consolidation, then expands (impulse), then may retrace, reverse, or consolidate again. Each phase leaves “fingerprints” you can learn to read.
    – Practical rules: don’t chase price; identify the current condition, apply the matching tool (e.g., wait for price to return to an order block after an expansion), and wait for confirmation (impulse or retracement). Use simple aids like Fib midpoint to find equilibrium.
    – Learning path: study examples on historical charts, focus on mastering one characteristic first to develop consistency, and supplement this course with the free prerequisite tutorials (Market Maker series, Precision Trading Concepts, Sniper series).
    – Goal: provide a clear framework to anticipate price, select the right tool for the market condition, and build consistent trade setups through practice.