Year: 2026

  • Trade Explanation AM Session & Hangman PD Array 07\16\2026

    Trade Explanation AM Session & Hangman PD Array 07\16\2026

    https://www.youtube.com/watch?v=Dj0663u7VRc

    Summary:

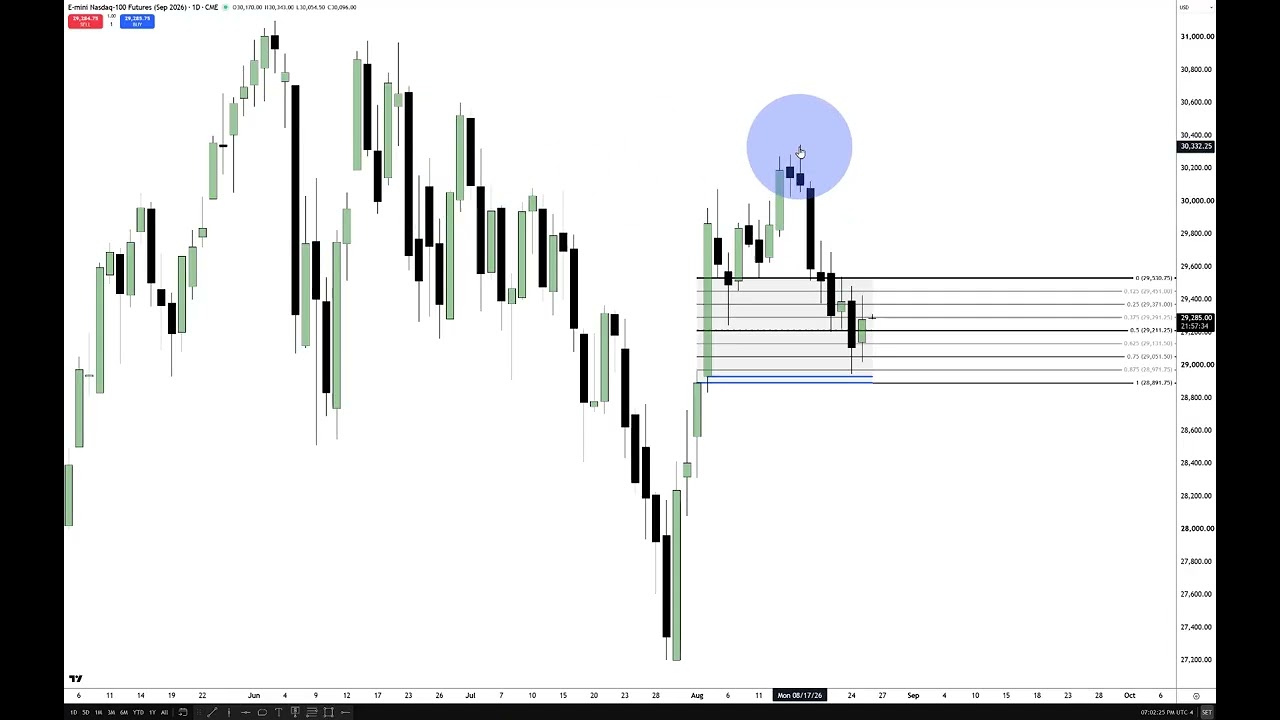
    – Market view: The presenter expected and saw lower prices after a daily close below a key volume/inefficiency area (sell-side liquidity with relatively equal lows). That setup increased the probability of downside continuation and possible gap lower by Sunday if momentum picks up.

    – Key technical concepts used: daily/weekly anchoring, suspension blocks, buy-side imbalances / sell-side inefficiencies (fair value gaps), quadrants/octants, “consequent encroachment” (midpoint) and “first utilization/first presented” — all used to judge whether a zone will act as premium (resistance) or inversion (support).

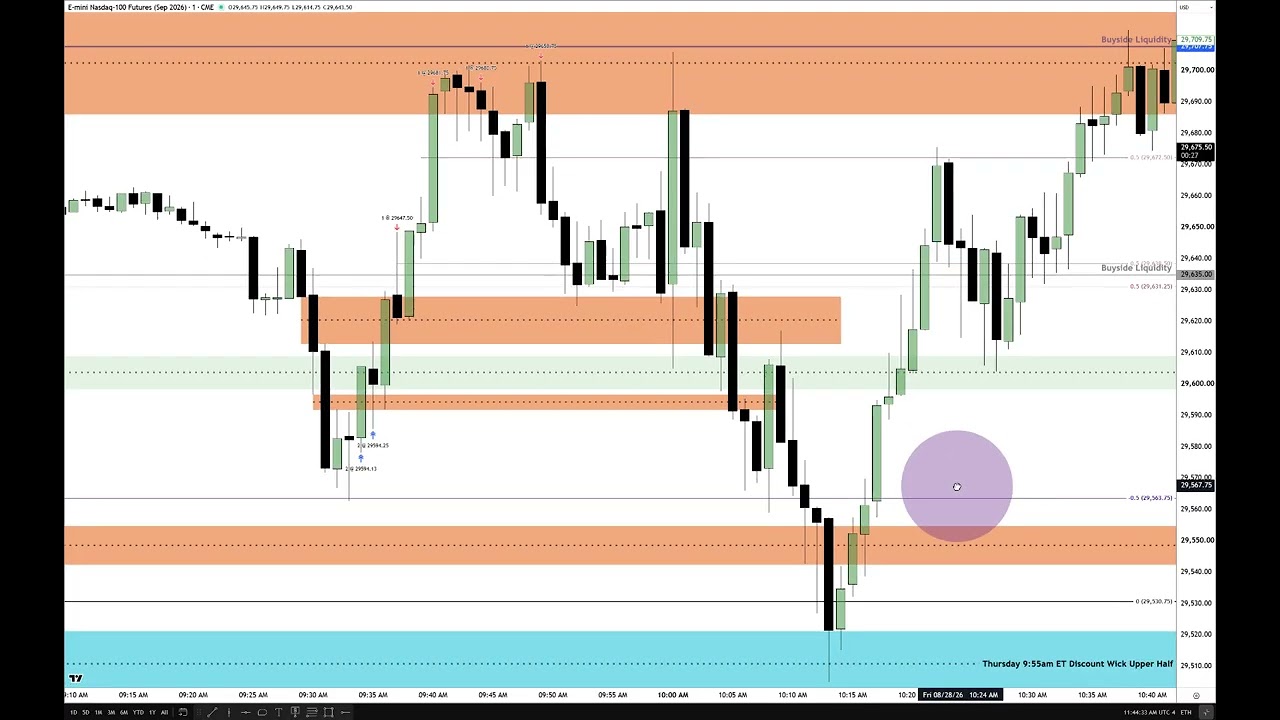
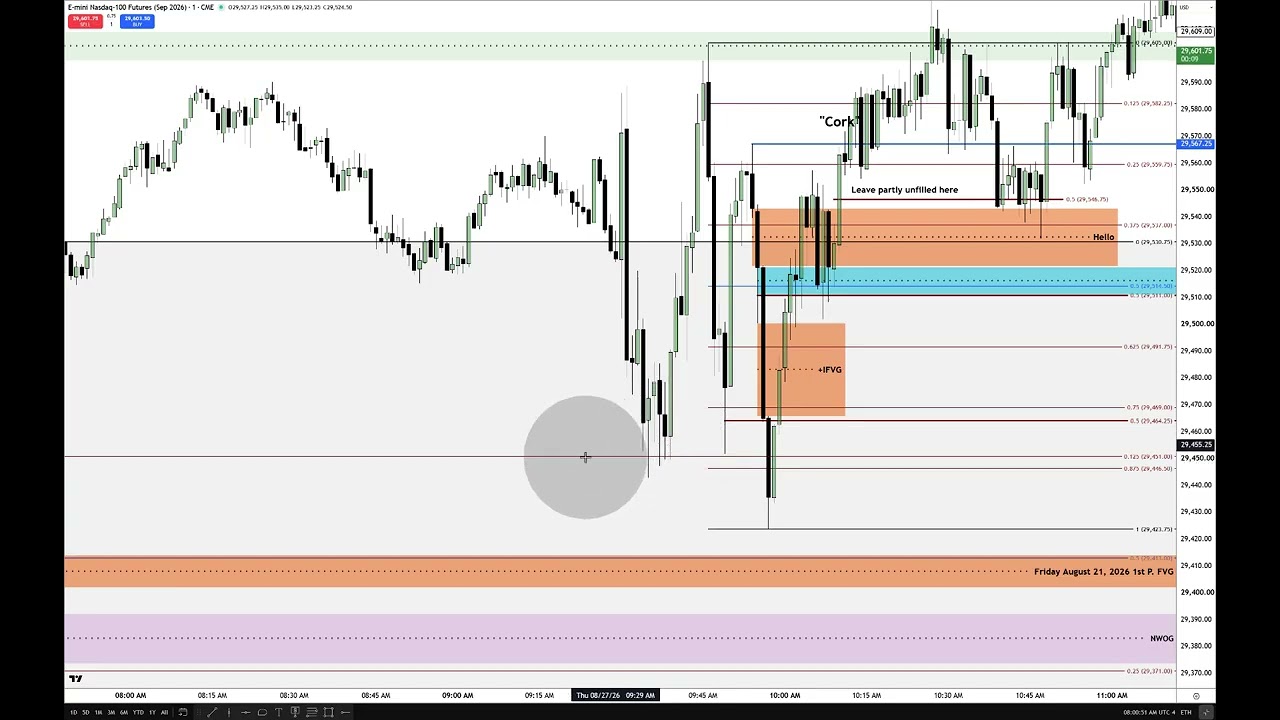
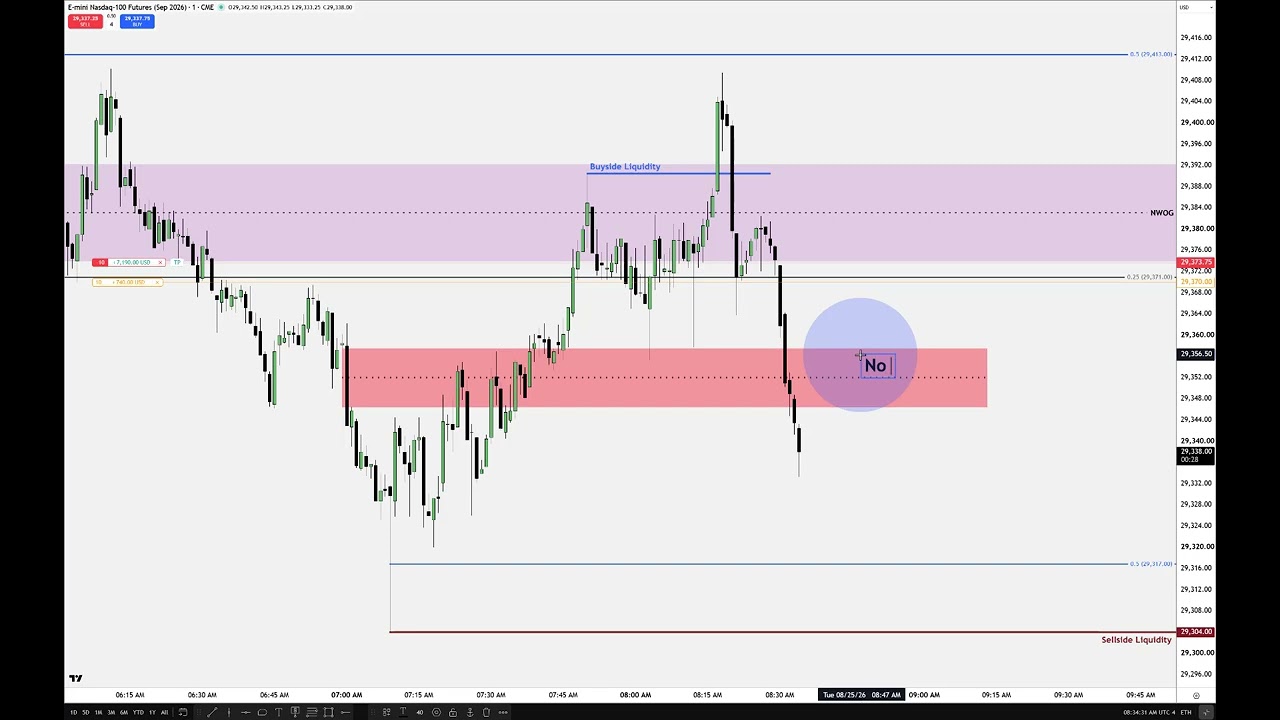
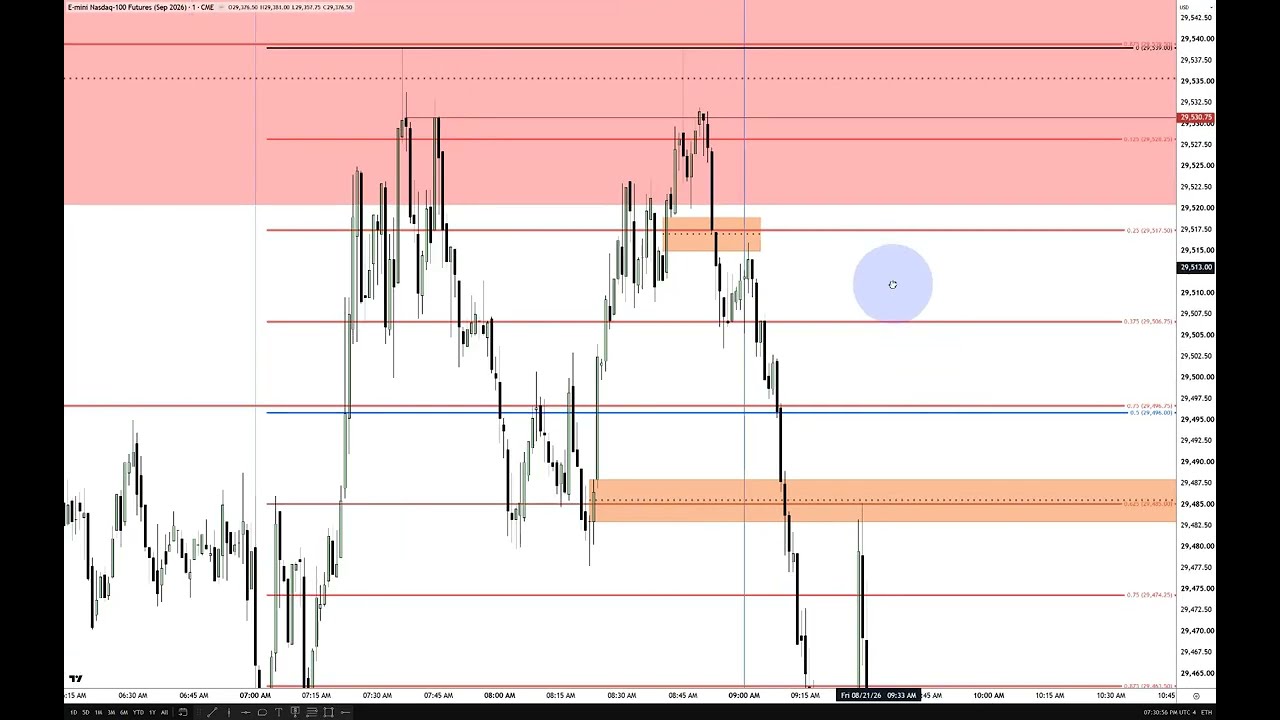
    – Intraday action: On the hourly and 1-minute charts, price interacted with a daily suspension block and a 1-hour buy-side imbalance formed Wednesday. Price hit the lower quadrant of the daily inefficiency at the 9:30 open, then rejected and moved lower into the annotated fair-value gaps — validating the bearish thesis. Lunch macro (around 11:30 / 10:00 low) and subsequent price structure reinforced the down move.

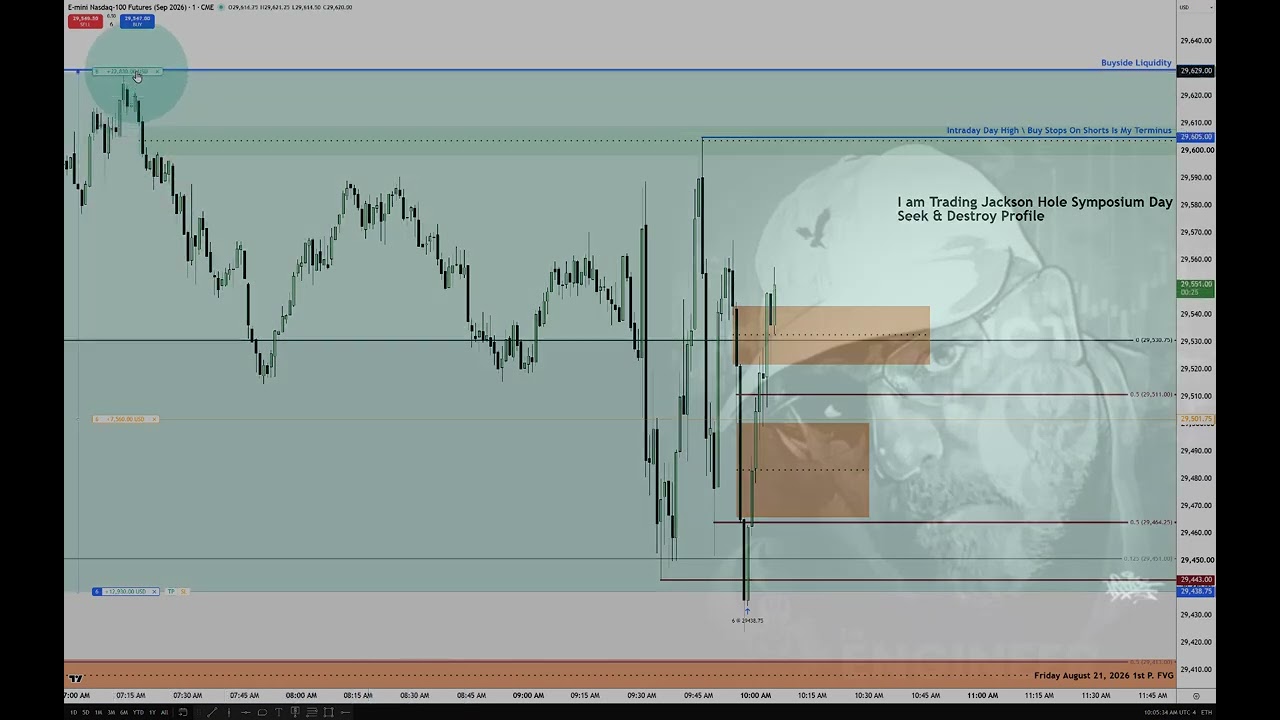
    – Trade execution notes: The speaker described missed ideal entries (wasn’t always in front of the chart), pyramiding short entries at inefficiencies, taking partial profits and being stopped out on remaining contracts. He emphasized bodies (open/close) over wicks for true order-flow information.

    – Market psychology and live streams: Retail chat often cheerleads the wrong direction; the public is usually wrong (contra-indicator). Advice: live streamers should largely ignore chat; viewers should not follow chat-driven crowd trades.

    – Teaching/philosophy: High-probability setups are those anchored to daily/weekly timeframes. The instructor keeps certain personal notes/private levels to avoid students overfitting to his precise entries — encourages students to develop their own models through study and repetition.

    – Practical takeaways: Watch for closes below key levels to validate bearish first-utilization, prioritize anchored higher-timeframe levels, use inefficiencies and fair-value gaps to time entries, prefer bodies (open/close) as volume/algorithms’ signals, and cultivate independent trading judgment.

    – Closing: The week’s technical calls mostly played out as taught; consistent study of the method and exposure to the live lessons will speed learning.

  • Post PPI NQ Futures Commentary \ Weekly Analysis Delivered – 07/15/2026

    Post PPI NQ Futures Commentary \ Weekly Analysis Delivered – 07/15/2026

    https://www.youtube.com/watch?v=LBrsLPKXZ2E

    Summary:

    – The speaker reviewed his pre-market tape-reading plan for NQ around the 8:30 PPI release: either price would drop then rally into the new-week opening gap, or rally into the gap then drop. He favored the scenario that would revisit the lower area because the rally was supported by very thin buying (a “toothpick”).
    – Key trading concepts emphasized: order-flow/liquidity dynamics (staging, Judas swings, buy-stop absorption by smart money), using price structure (open/high/low/close and time) rather than fancy indicators, and building short positions in the lower quadrant/upper octant while avoiding the gap’s halfway point.
    – He walked through his live execution: pyramiding into shorts, taking partials to manage risk/psychology, a missed stop execution due to spread/liquidity, and exits around predefined levels. The price later moved into the expected sell-side liquidity and daily volume imbalance areas, validating the plan.
    – Major behavioral and practical lessons: you can’t know outcomes for sure—use stop losses, don’t overleverage, demo trade and log trades, and develop patience, discipline, and responsibility. Trading is a craft that takes years; his method is simple but requires experience.
    – He’s done trading for the week, will focus on teaching, and encouraged students to re-watch prior lectures to see the levels and logic in context.

  • Post CPI NQ Futures Commentary \ Monday Analysis Delivered – 07/15/2026

    Post CPI NQ Futures Commentary \ Monday Analysis Delivered – 07/15/2026

    https://www.youtube.com/watch?v=IF7dEkgWoO0

    Summary:

    – The speaker reviews recent price action around levels he flagged earlier (including a sweep near 29,395 and a prior low ~29,545), explaining how the CPI print drove a rapid move and created actionable liquidity and fair-value gap (FVG) situations.
    – He describes trades taken: short entries into a suspension/first-presented FVG, partial exits to target measurements, a final contract stopped out (small loss acceptable), and how subsequent wicks, closes and fills changed the character of various FVGs (inversion → reclaimed/bullish).
    – Key technical themes: liquidity sweeps, relative equal highs/lows, suspension/first-presented FVGs, breaker/order block behavior, and institutional entry drills — all used to judge whether lower or higher prices were likely.
    – Market structure shifted bullish when candles failed to close below certain wicks and when an inversion FVG was not confirmed; price later rallied into and interacted with the new-week opening gap and other liquidity pools.
    – Near-term outlook: he expects possible continued upside (unfinished business higher) but also notes a vulnerable “single toothpick” candle supporting much price — that area may be traded before week’s end. PPI (and other major data) could produce a two-stage move (drop then rally) or trigger a breakdown if a rally fails.
    – Trading advice: don’t rely solely on him — form and test your own models, compare your analysis to his to learn, and treat major news events (PPI/CPI/FOMC/NFP) with caution — wait for high-probability setups rather than forcing trades.
    – He points viewers to his YouTube/live executions for real-time examples and says he’ll follow up later with more commentary.

  • Trading Complex Opening Ranges With Fed Impact 07/14/2026

    Trading Complex Opening Ranges With Fed Impact 07/14/2026

    https://www.youtube.com/watch?v=fFi2QEApVGM

    Summary:

    – Context: Trading a short ahead of the Fed chair’s 10:00 remarks, expecting the speech to create volatile, whipsaw price action and to disrupt apparent trend-line support.
    – Key levels referenced: yesterday’s regular trading hours/opening-range gap, the 8:30 low, an “inversion fair value gap,” and an “event horizon” target below those lows. A decisive single-candle break below the 8:30 low was needed to accelerate the move lower.
    – Plan and execution: initial stop loss placed above the recent high; position sizing adjusted (adding/removing contracts) and partial profits taken at intermediate levels (around the 8:30 low and event horizon). Stops were trailed down as partials were secured, but not tightened too quickly to avoid Fed-induced whipsaws.
    – Market behavior: price showed reluctance to decisively break lower, produced wicks and retracements, and briefly hit/failed target levels—leading to partial fills and a stop-out on remaining size.
    – Practical lessons: in Fed-driven, choppy conditions don’t “strangle” positions—give trades room, manage risk with partials and trailing stops, accept being stopped out sometimes, and build confidence through repeated experience. Avoid overreacting to noise and don’t rely on replaying the market.

  • Part 2 \ How To Probe Low Probability RTH Opening Ranges 07/14/2026

    Part 2 \ How To Probe Low Probability RTH Opening Ranges 07/14/2026

    https://www.youtube.com/watch?v=bz4QNPcpmWE

    Summary:

    The speaker reviews yesterday’s lesson about probing a low-probability opening range to the downside, clarifying why they focused on specific relative equal lows and a lower volume imbalance on the daily chart. They emphasize using higher-timeframe levels (daily/weekly) for probability and explain their one-minute/9:30AM analysis showing how the market made a regular-trading-hours low, was briefly swept lower in electronic hours, then produced structure shifts overnight (breakers, fair value gaps, liquidity sweeps) that pointed toward a rally.

    Key observations:
    – The annotated lows were chosen because they aligned with volume imbalances and were the first drops from the 9:30 area.
    – Overnight price action showed testing of those lows, then rallies through value areas toward Monday’s opening-range gap and the new-week opening gap.
    – There is unfinished upside “business” in those gaps, so the speaker expects price may move higher (today or on tomorrow’s PPI).

    Risk guidance:
    – Do not hold speculative positions into economic releases (CPI/PPI); the speaker will not trade them.
    – Strong advice to manage risk carefully—don’t gamble unrealized profits into release events.

  • How To Probe Low Probability RTH Opening Ranges 07/13/2026

    How To Probe Low Probability RTH Opening Ranges 07/13/2026

    https://www.youtube.com/watch?v=rtIcbG6twrI

    – Context: The host and Caleb review the coming week’s schedule—major CPI and PPI releases and Fed speeches on Tuesday and Wednesday—so expect heavy morning volatility those days. They prefer trading PM sessions after the initial noise settles.

    – Monday outlook: No scheduled news today, so price could be quiet or build into the bigger Tuesday/Wednesday moves. The speaker is approaching Monday with a clean slate and caution rather than a fixed bias.

    – Chart read (high level): Price is inside a large range with a daily wick/volume imbalance at the lows and a notable weekend/opening gap. Gaps and inefficiencies (fair value gaps) are key levels; regular trading hours carry more weight than overnight/electronic prints.

    – Intraday plan: Monitor 15-minute and 1-minute structure, use the opening-range gap midpoint and order blocks as primary levels. Probe with a single contract to test liquidity and reaction, manage risk with tight stops (below encroachment/imbalance levels), and look to reverse into longs if probes fail to push lower.

    – Execution details: Focus on candle bodies (not just wicks) to confirm moves, limit activity during the high-volatility opening minutes, and avoid trading large size in demo-like behavior. Paper trading is used for compliance/demonstration.

    – Risk & discipline advice: Have a model and reasons for each trade; responsibility for outcomes is always the trader’s. Novices should generally avoid trading Mondays (except NFP Mondays). Preserve capital, avoid chasing trades, and don’t overtrade to prove competence.

    – Meta points: The market’s structure and price-action concepts (gaps, order blocks, fair value gaps) underpin the approach; many others and AI tools have begun echoing this terminology. The speaker emphasizes experience, manual verification over blind automation, and skepticism of flashy mentors.

  • Market Review & NQ Futures Trade Recap 07/08/2026

    Market Review & NQ Futures Trade Recap 07/08/2026

    https://www.youtube.com/watch?v=JmAJfuSkY1g

    Here’s a concise summary of the commentary’s key points and the day’s trade analysis:

    – Core method: order-block theory — the last up-close candle (if it’s the largest of consecutive candles) defines a bearish order block; the open only matters if price closes below it, which signals a state change.
    – Wicks matter: full wicks create inefficiencies; you must grade wicks and use consequent encroachment levels (price closing below a wick’s encroachment supports continuation down).
    – New day opening gap (NDOG) and opening-range gap: NDOG (settlement to electronic-open gap) and the 9:30–10:00 opening-range 50% are important reference levels (the 50% retrace has ~70% likelihood of being traded).
    – Market context: the move fit a “market maker sell model” — consolidation → reaccumulation → smart-money reversal → first/second-stage distribution → a drop targeting sell-side liquidity (often without taking out the original consolidation).
    – Fair value gaps (FVGs) and inversions: observed buy-side imbalance became a bearish inversion FVG, then later a bullish FVG after the break; bodies and consequent encroachment within FVGs indicate likely short-term direction.
    – Breaker concept: identified a bearish breaker (using the body that goes lowest, not one with a wick) which added to bearish confluence.
    – Time confluence: macro time window (≈10:50–11:10 ET) and other timing elements reinforced the expected downward move.
    – Trade actions: entered short inside the breaker, used halfway targets for partial profit (the “event horizon” exit), missed an earlier ideal short while asleep, and managed stops around volatile wicks; later price reversed, closed gaps, and spent time in NDOG/no-man’s land.
    – Main takeaway: multiple technical confluences (daily bearish order block, wick inefficiencies, breaker, FVG inversion, opening-range behavior, and timing) supported a high-probability bearish thesis for the session; execution required patience and stop management amid volatile wicks.

  • One Shot – One Kill Trade Setup Review

    One Shot – One Kill Trade Setup Review

    https://www.youtube.com/watch?v=zq4hz_XiTRE

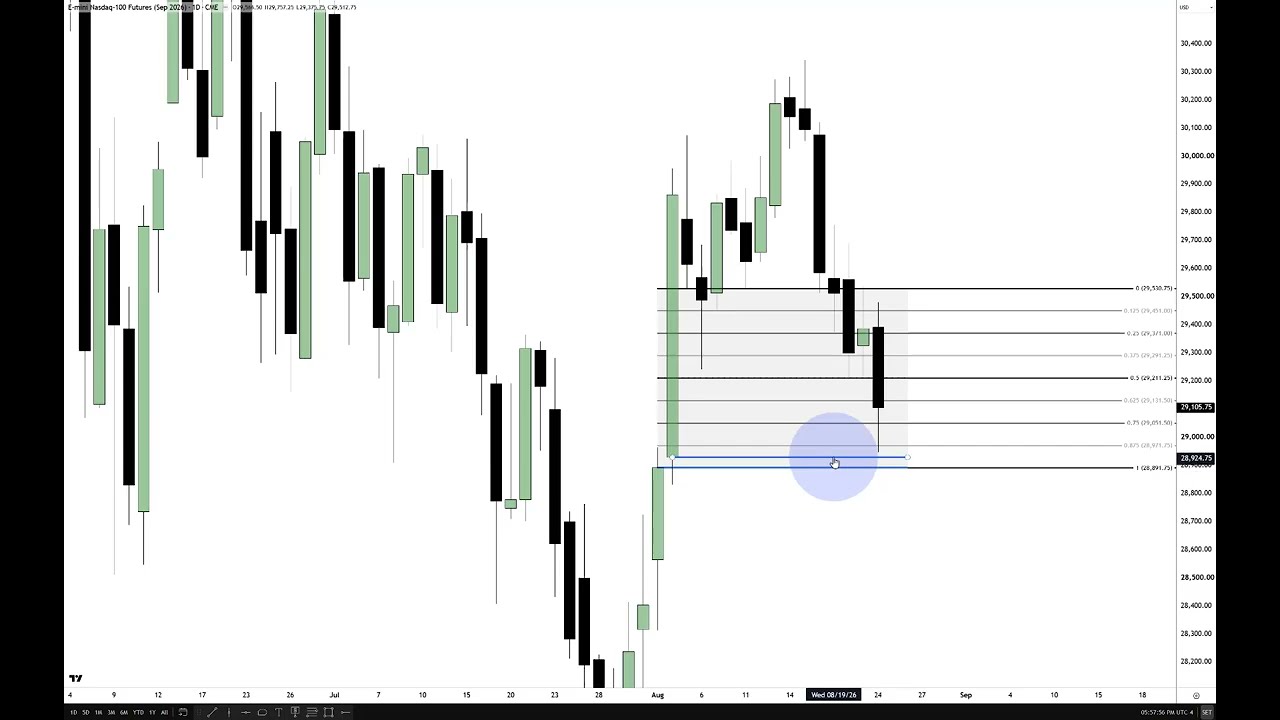
    – The presenter reviews recent Nasdaq action using a daily chart plus a focused 15-minute view. He highlights two daily reference points: the “discount wick” (low) and the “up‑close” candle/open (order block/change-of-state), with a key consequent‑encroachment level around 29,221.75.

    – The 15‑minute timeframe is treated as a bellwether for intraday/scalp setups and to sync with higher‑timeframe moves. He maps how price respected those daily boundaries, traded down into the discount wick, swept sell‑side liquidity (including last Thursday’s low), then quickly returned into the prior range.

    – Technical concepts used: order blocks (his own definition), fair value gaps and inverted FVGs, SIBI/inefficiencies, relative equal highs/lows, lunch‑macro and opening‑range algos, liquidity pools and buy/sell‑side sweeps. He stresses blending timeframes to frame higher‑probability entries.

    – He emphasizes process over indicators: use plain open/high/low/close candles, avoid gimmicky candlestick or volume overlays, and measure price structure and body/wick behavior rather than “form‑fitting” after the fact.

    – Risk and trade approach: prefers a “one‑shot, one‑kill” short‑term model (few high‑confidence runs per week), warns against forcing trades, overtrading, and holding into weekend gap risk. Notes current volatility is extreme and position sizing/stop discipline is critical.

    – Administrative: he corrected a drawing error in his slides, reiterates that his pre‑market commentary predicted the move, and announces upcoming lessons on building a trading path (without using simulated prop firms) over the next few days.

  • Analysis Delivering On NQ

    Analysis Delivering On NQ

    https://www.youtube.com/watch?v=N3qz13Hl-gg

    – Context: Live analysis of the NASDAQ September 2026 contract on the 15‑minute chart, carrying over levels from yesterday with added lines marking buy/sell balance, efficiencies, and a sell‑side liquidity pool.

    – Thesis: The market was expected to break below recent relative equal lows, build downside momentum and fill a shaded inefficiency/fair‑value gap down into the sell‑side liquidity pool. Prefer no large wicks back into the upper half; ideally the gap becomes an inversion to lend further bearish conviction.

    – Intraday plan/observations: The analysis moved to the 1‑minute to watch the open. Early volatility could instead use a minor buy‑side inefficiency to run up; if bodies stay below the key level it supports the bearish scenario. A close below the fair‑value gap would warrant further downside.

    – Trade management guidance: For shorts, take the bulk off at the “low‑hanging fruit” objective and keep one or two contracts as runners for the best‑case target. Suggested a short entry on the retest (above‑then‑down) candle; stops would have been above the trailed buy stops that were hit.

    – Execution/result: The commentator did not trade (felt fatigued) but noted the price largely behaved as forecast—bodies remained inside the gap and touched the targeted inefficiency. Further move lower would confirm the move.

    – Tone: Casual banter with a colleague and confidence in the method; the analyst emphasized that the setup and levels are what make the calls work.

  • Post US Holiday Monday Followup

    Post US Holiday Monday Followup

    https://www.youtube.com/watch?v=2bke4YH6ZuE

    – Instructor reviewed the 15‑minute chart (highlighting fair-value gaps/inefficiencies) and described price action: the market moved into an inefficiency, retraced into a fair‑value gap, reacted up to a lower quadrant, then failed to reach the next octant and remained rangebound.

    – Key trading lesson: avoid trading on low‑participation days—especially Mondays following U.S. bank holidays that fall on weekends—because liquidity is thin and price action is erratic. Tape‑read instead; don’t demo‑trade or force real risk.

    – When the open is in the middle of a range (near the 50% / equilibrium), conviction is low and probability edges are unclear. Submit to price action, gather more data, and use “if‑then” rules rather than betting decisively early.

    – Practical approach: mark the high/low of the dealing range and the internal inefficiencies/liquidity pools. Use those levels to decide actions only if the market proves a directional preference (sustained break or clear run).

    – Behavioral advice: don’t force trades to satisfy ego or FOMO. If you lack impulse control, step away from the screens. Accept missing moves and learn from mistakes—today’s losses are lessons about not trading low‑probability conditions.

    – Macro context: expect quieter, choppier “dog days” of summer and politically/manipulatively influenced markets—favor one‑direction, high‑alignment setups and reduce participation otherwise.

    – Personal note: the presenter traded with his son, misread one scenario, mitigated risk, and used the example to reinforce risk discipline and the value of waiting for cleaner setups.