Year: 2026

  • PPI Market Review August 13, 2026

    PPI Market Review August 13, 2026

    https://www.youtube.com/watch?v=RVHX56v-gUo

    Summary:

    – Host has a sinus headache and will keep the update short; may be offline for a while.
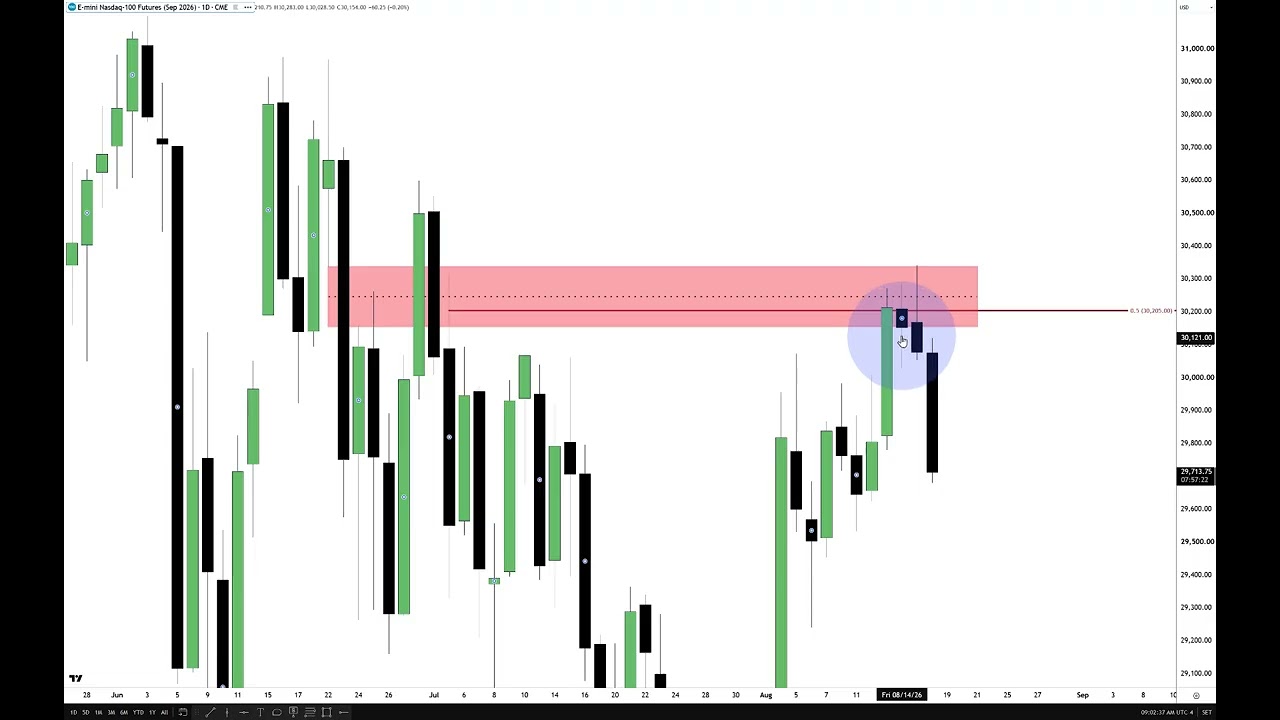
    – Reviewed NASDAQ price action: initially expected a downside into a defined objective, but post-PPI/CPI price action pushed the market higher toward Wednesday’s and last week’s highs.
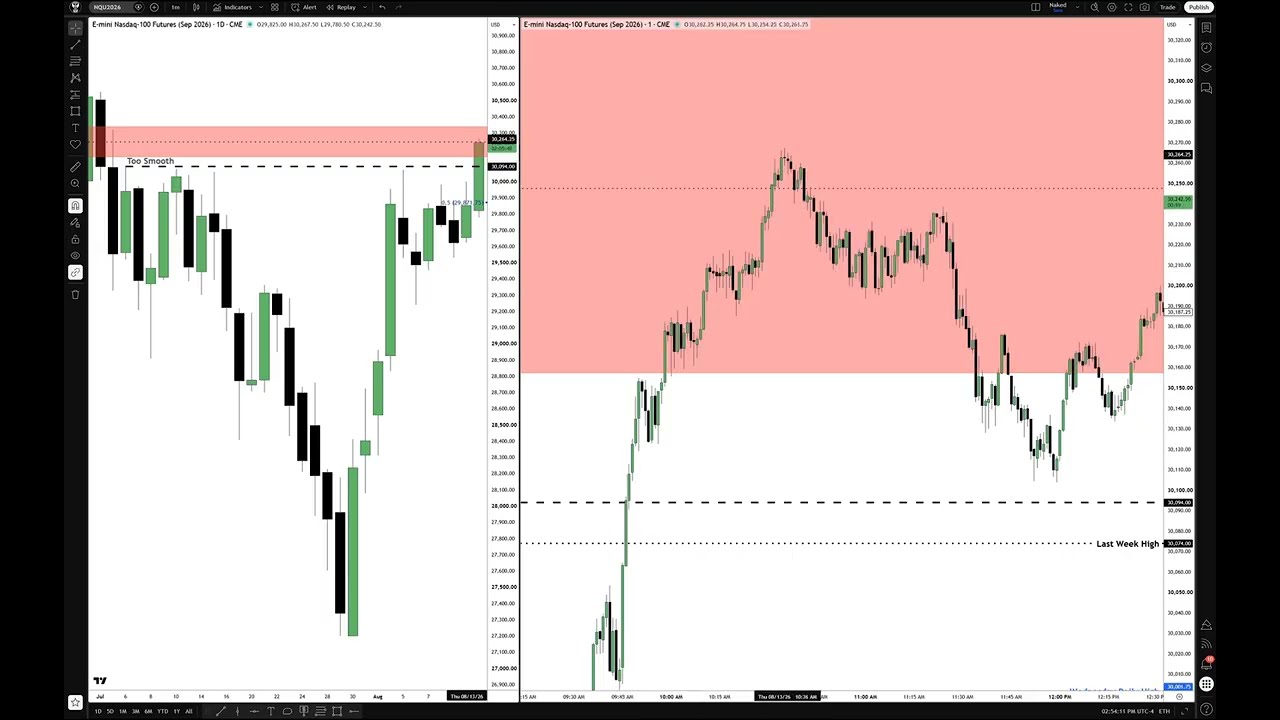
    – Intraday behavior: quick 9:30 run, swept prior highs, then pulled back into a fair value gap and institutional order block area before ripping higher.
    – Trading actions: considered a short into the pullback but switched to long as the market showed unwillingness to go lower; peeled partials and trailed stops; missed some of the late extended move.
    – Key technicals referenced: midpoints, 50% retracements, fair value gaps, consequent encroachments, and daily highs/wicks used as entries/stops.
    – Levels and bias: short-term bullish bias — not interested in shorts. Stop mentioned around 30,120. Upside objectives roughly 30,600 and ~30,975; potential for new all-time highs.
    – Will likely be offline and not trading more today; may post another lecture later but no promises.

  • Whats So Smart About My Concepts?

    Whats So Smart About My Concepts?

    https://www.youtube.com/watch?v=La2fTewydjw

    Summary:

    – The speaker defines the weekly market range by obvious, prominent price legs (Monday London session high to relative equal lows). Since the market took out both the highs and lows, the week’s range is considered fulfilled; upcoming economic prints don’t change that outlook.

    – Core teaching: always first identify where the market is likely to gravitate. Grade that swing with octants/quadrants to find high-probability price levels (midpoint, octants, quadrants, low) where PDAs, entries, and stops should be placed.

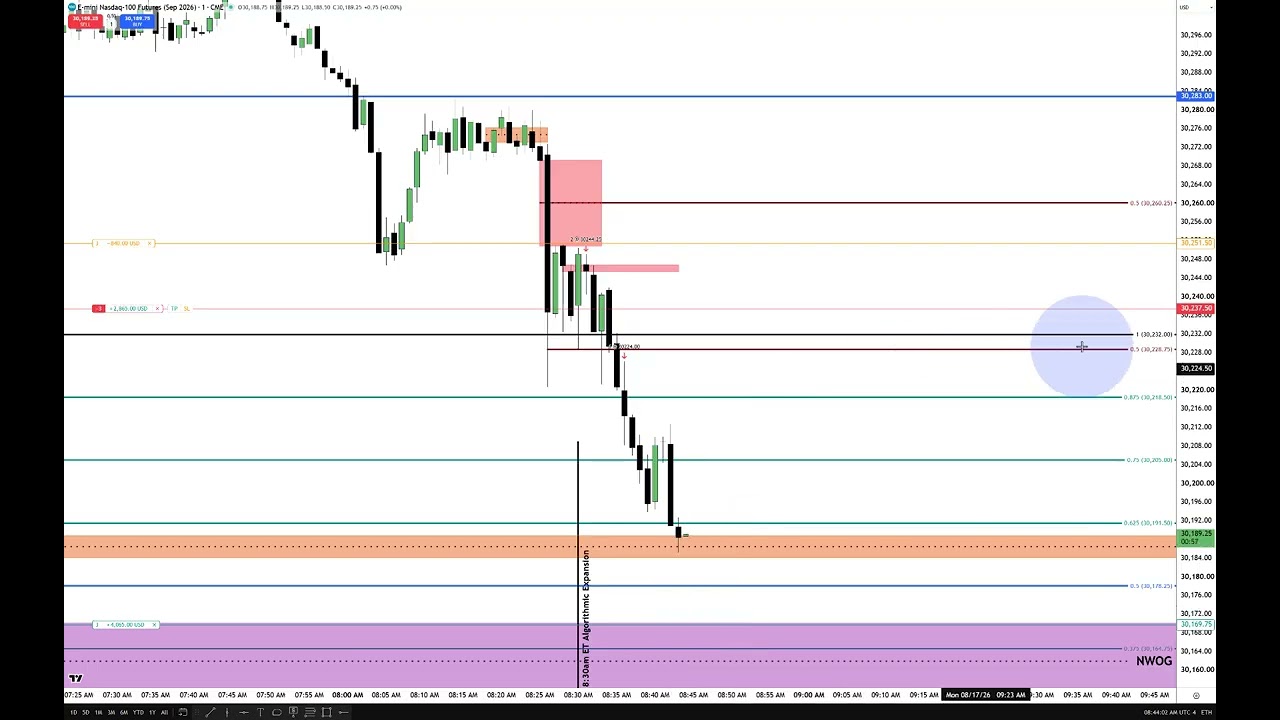
    – On high-impact news (CPI at 8:30) advice: avoid trading the initial candle(s) because fills and slippage are bad. Wait a couple minutes for volatility to settle and then look for areas “left in the wake” (discounts/liquidity runs).

    – Uses smart-money concepts (order blocks, breakers, inversion fair value gaps, buy‑side/sell‑side efficiency) across very short timeframes (1-min, 15-sec, 5-sec) to find precise entries, pyramid positions, and set stops (e.g., just above the candlestick high that validates a breaker). Trade smaller size / lower leverage if stops require wider placement.

    – Critiques simple retail tools (moving averages, crude support/resistance) as insufficient for precision; his methods aim for repeatable, precise execution and have produced profitable students.

    – Trading philosophy: trade to make money and build financial legacy, not to impress others. The speaker offers much of the teaching publicly (YouTube) and reports a very successful week.

  • ES Day Trade Review With 1min & 15Sec Timeframe

    ES Day Trade Review With 1min & 15Sec Timeframe

    https://www.youtube.com/watch?v=KEqzv2yOAf0

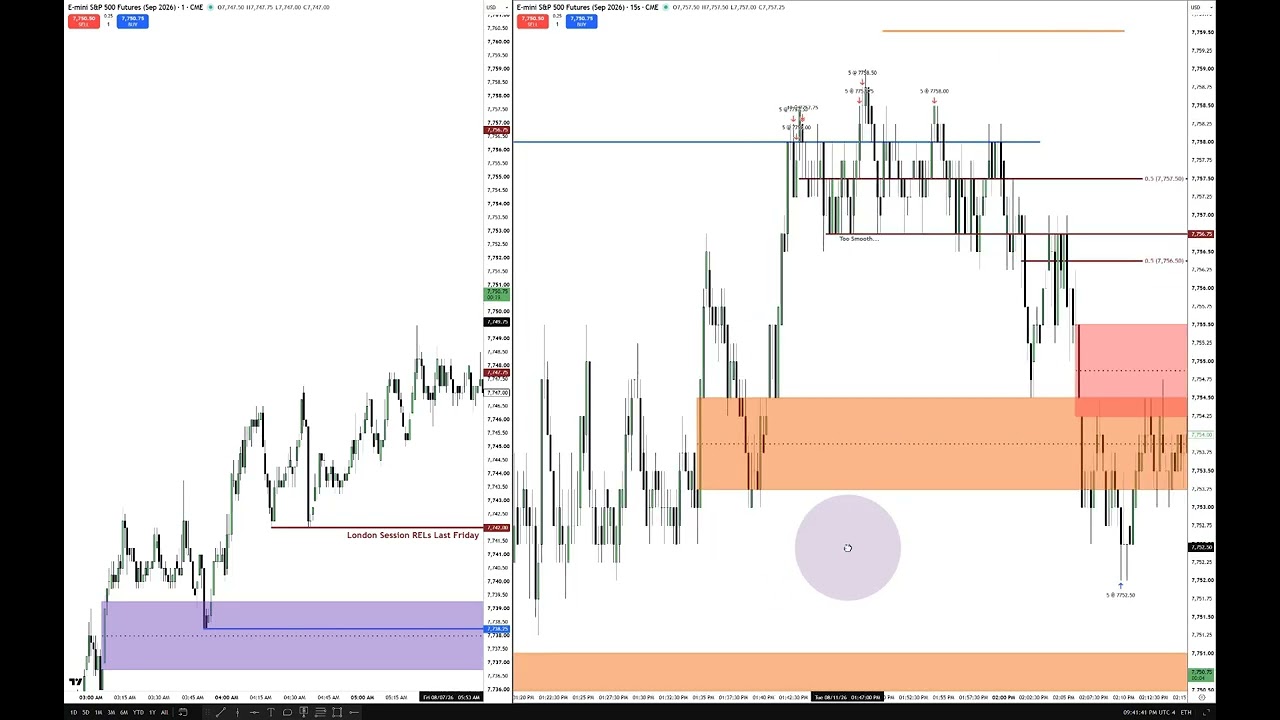
    – Context: A quick review of the September‑2026 S&P 500 futures trade shown on a 1‑minute chart and a 15‑second chart (each candle = 15s on the right).

    – Key technical levels annotated: last Friday’s London‑session relative equal lows, a suspension block, and a buy‑side liquidity pool. The trader placed limit exit orders just ahead of that relative‑lows level and exited before price reached the suspension block.

    – Entry rationale: a short‑term high and a swing‑trader fulcrum/measured‑move setup — the idea that the measured move up should project down. The immediate objective was “low‑hanging fruit” execution just above the relative equal lows.

    – Price behavior and execution: the market respected levels very precisely (to the tick). There were inversion fair value gaps (IFVGs), volume imbalances, smooth rollovers, and repeated body/ wick interactions at key prices. The trader took partials at the IFVG and other levels, removed singles as price declined, then re‑entered/remained active as price rotated back.

    – Market commentary: S&P is described as a “gentleman’s market” — cleaner and more precise than NASDAQ or the Dow. NASDAQ moves are larger and can reveal cracks in correlations; choice of market should match a trader’s personality.

    – Outlook and process: CPI release tomorrow (8:30 ET) — the trader will not speculate. He shared an unedited (sped‑up) execution video for students to study 15‑second candle behavior and price delivery.

    – Philosophy and teaching plan: he rejects adopting other people’s methods, argues his approach is superior and broadly applicable across asset classes, and plans to focus his content and teaching on his method over the next two years.

  • AM Session Review & Course Correction

    AM Session Review & Course Correction

    https://www.youtube.com/watch?v=0Bu4g-2aMA4

    Here’s a concise summary of the commentary:

    – The market failed to run up to the relative equal highs as hoped; instead it opened down and initially pushed through relative equal lows and nearby liquidity pools.
    – Key price references were the high/low of a retracement leg and the opening price of the last down-close candle, which converged with the relative equal lows as an important liquidity area.
    – Candlestick wicks (not bodies) defined how far price was willing to probe lower; the body held above mid-levels and then price rallied back.
    – The trader expected a run back up to take out several highs but was stopped out after a reversal; economic calendar (CPI/PPI) and pre-market conditions contributed to a non-trending, choppy session.
    – Identified an inefficiency from Friday and constructed “gray pole” levels from consecutive wicks to highlight likely unnoticed gap areas—these were tapped before a sell-off.
    – After price dropped below the low, the trader accumulated positions as it retraced into a range and created relative equal highs; now suspects a possible further move down toward two nearby relative equal lows.

    Overall: attempted long bias reversed by unexpected selling; price structure, wick behavior, and liquidity pools guided entries/exits, and a further downside into defined equal lows is now considered likely.

  • How To Frame Sessions In High Resistance Liquiidity Run Conditions

    How To Frame Sessions In High Resistance Liquiidity Run Conditions

    https://www.youtube.com/watch?v=C7CwjBOtHwM

    Summary:

    The speaker explains how he derived key price levels and why he trusted certain setups, emphasizing session structure, liquidity, and the economic calendar. With CPI (Wed) and PPI (Thu) coming, he expects muted, range-bound regular trading on Mon–Tue and larger, one-sided moves midweek. Electronic/pre-market hours (London, overnight) are more likely to trend when big data is scheduled later in the week.

    Key points and rules he uses:
    – Anchor Fibonacci and grading to session extremes (highest high / lowest low) to find meaningful quadrants (e.g., the 0.75 lower quadrant).
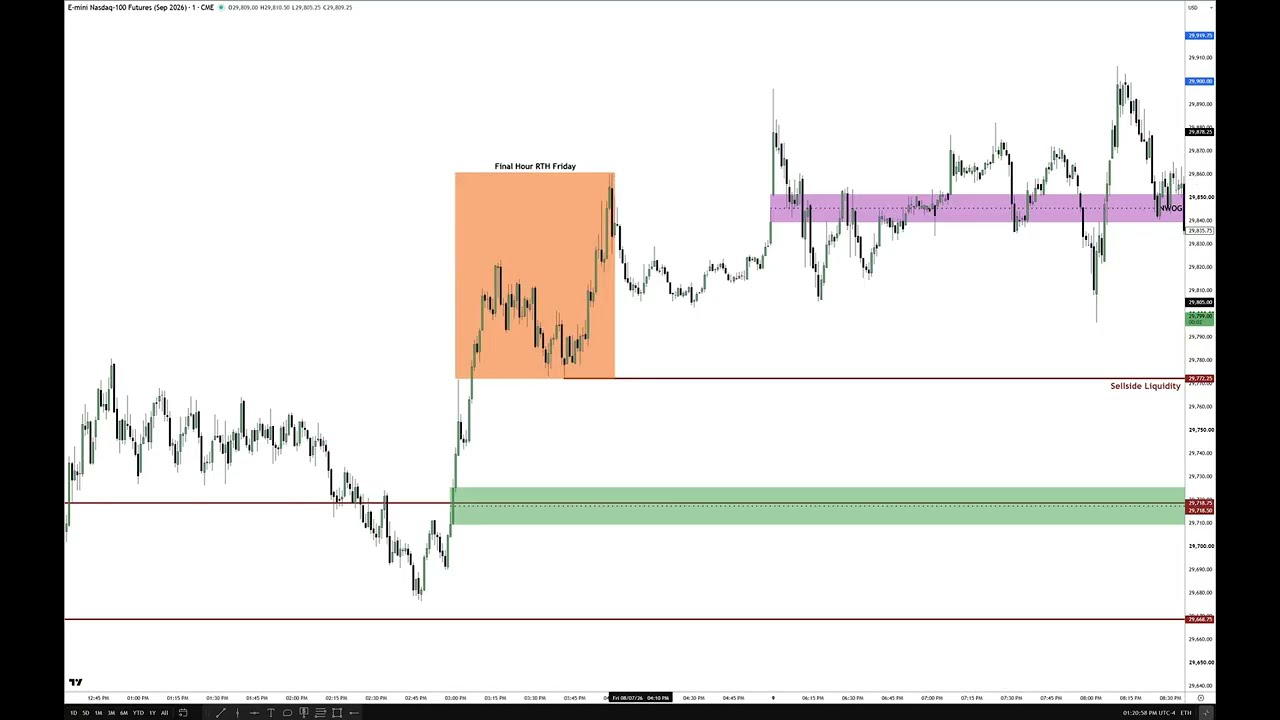
    – Use the final RTH (regular trading hours) Friday low and the new-week opening gap as important liquidity reference points.
    – Treat the first 30 minutes of the pre-market as the “dealing”/opening range for that session (similar to 9:30–10:00 RTH); grade levels from that range.
    – Midnight opening price is a key magnet; mark it on charts regardless of instrument.
    – Carry session ranges, octant/quadrant levels, and fair-value/inefficiency gaps forward as targets or rejection zones (inversion fair-value gaps can act as resistance/support).
    – Expect electronic sessions to trend more; expect RTH to be more range-bound ahead of major macro prints.
    – Don’t force trades; practice on demo/backtests—real money exposes tendency to force trades and requires discipline.
    – Trade management: accept stops, use partial exits, and learn to secure unrealized gains; trades won’t always be perfect.

    He reiterates his teaching order and content is posted for self-study and encourages viewers to review past videos before asking repetitive questions.

  • Navigating High Resistance Liquidity Run Conditions

    Navigating High Resistance Liquidity Run Conditions

    https://www.youtube.com/watch?v=O217xQsEUgI

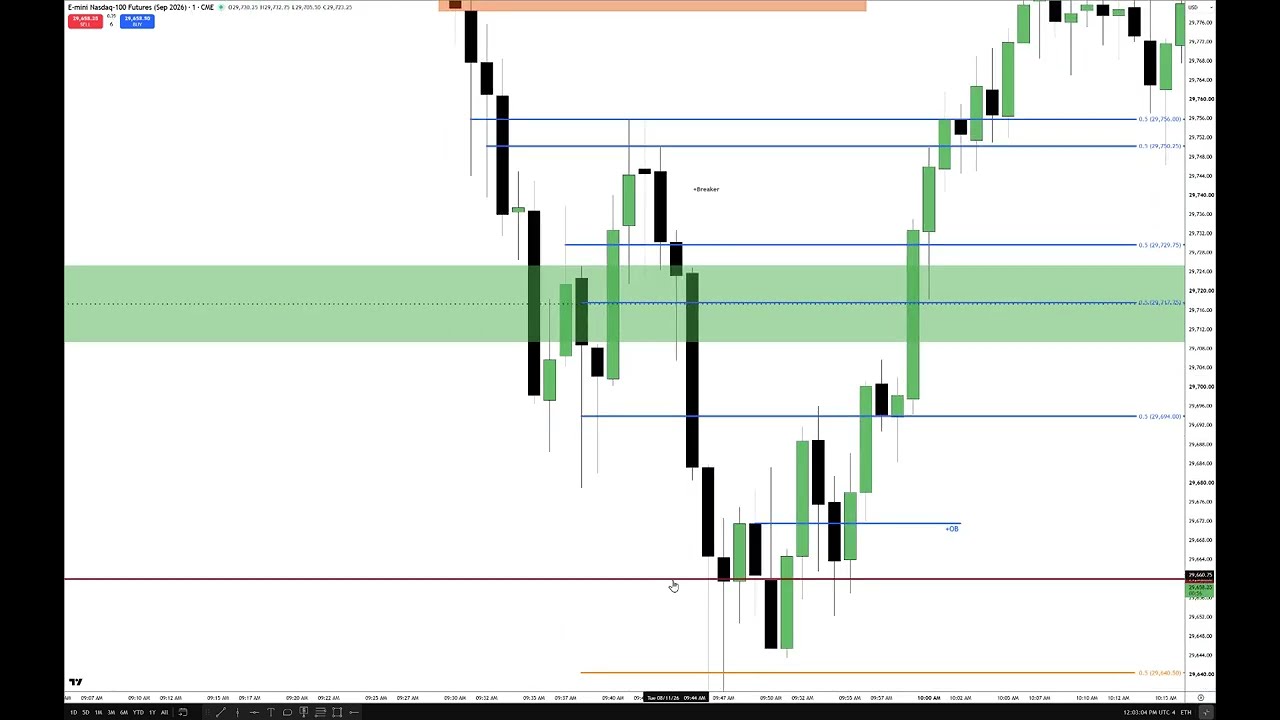
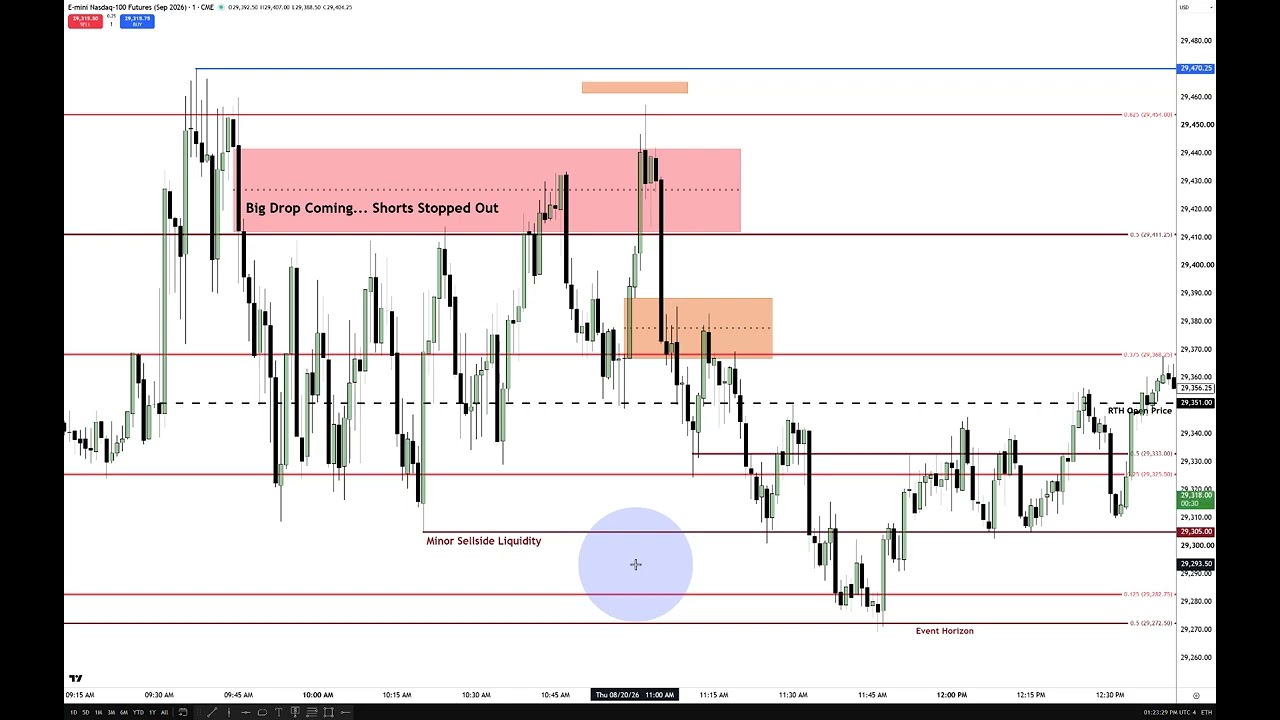
    – The speaker is trading live: initially went long four contracts, planned to add two then two more as price revisited an “inversion fair value gap” (a type of order-flow/price-dislocation zone).
    – Entries were clustered inside that gap; stops placed just below the gap’s low (with incremental tightening as the trade confirmed) to reduce risk.
    – He emphasizes managing position size with partials: took five off at a target (midnight opening price) and put a stop on two contracts to lock in gains while keeping exposure for further upside.
    – Key levels: inversion/bullish fair value gaps, wick mids/“consequent encouragement” levels, intraday highs, and the New York midnight open (described as a liquidity magnet).
    – No market-replay: he insists on trading and teaching from the live, hard-right edge (real-time price) rather than replaying past data.
    – Teaching focus: “smart money” concepts — anticipating order flow, reading candlestick behavior (bodies vs wicks), and predicting likely moves rather than merely reacting.
    – Practical risk/mental management: use partial exits and stops to reduce emotional pressure; trading with a paper account for teaching/legal safety.
    – Acknowledges possible messiness around news (CPI/PPI) and multiple nearby gaps/liquidity pools; stresses rules, process, and learning to interpret price action.

  • Case Study With NonFarm Payroll & NQ Futures \ August 07, 2026

    Case Study With NonFarm Payroll & NQ Futures \ August 07, 2026

    Summary:

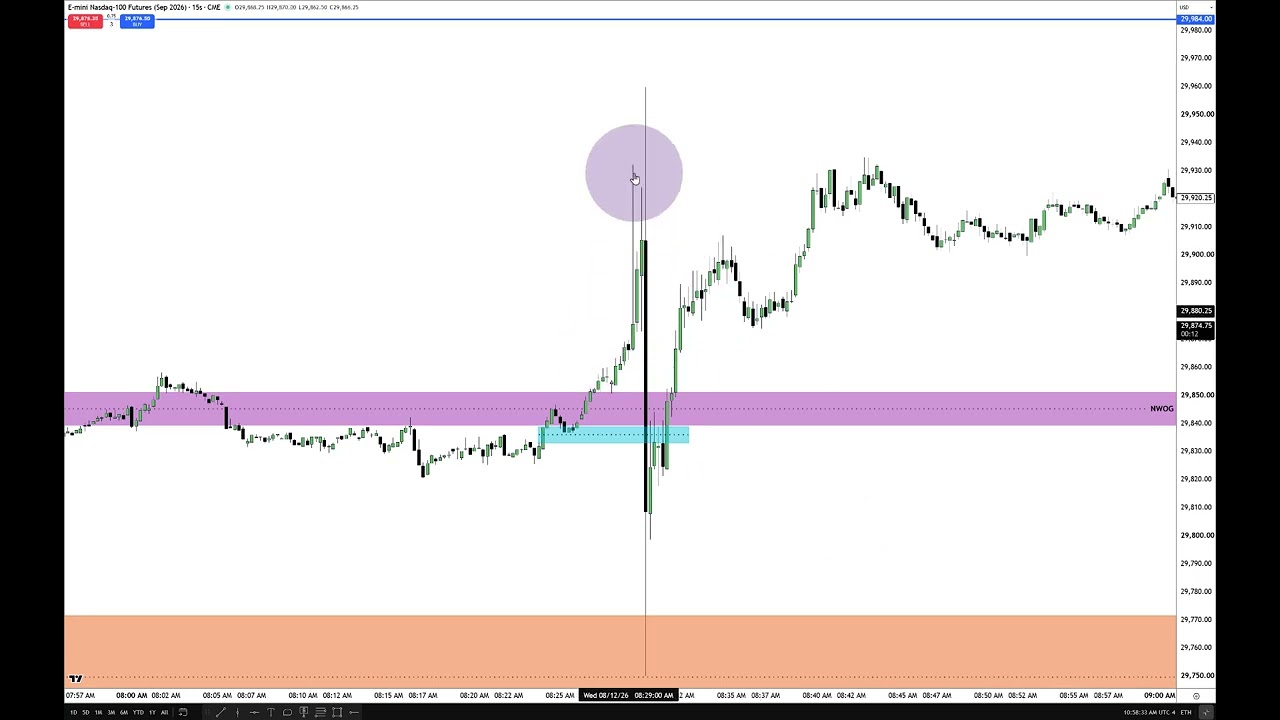
    – The speaker reviews NASDAQ price action on non-farm payroll (NFP) Friday and strongly warns inexperienced traders not to trade on Thursday/Friday of the first week of the month because NFP creates extreme volatility.
    – He uses a pre-market range from 7:00–8:30 a.m. ET (highest high and lowest low) to define the “dealing range” and guide trade expectations ahead of the 8:30 NFP release.
    – He had posted a target level of 29,780 and explains how price interacted with that level during the morning: initial consolidation, a rally into the target, then a macro-time (8:50–9:10) reversal—consistent with NFP’s typical two-stage move (initial spike then retracement).
    – He describes his trade mechanics and tools: algorithmic projections, standard-deviation targets, Fibonacci anchoring, concepts like buy/sell-side balance, fair-value gaps, encroachment/octants, and liquidity runs. He entered a demo (paper) long on three contracts, took a partial profit around the halfway point, and emphasized conservative sizing and risk management.
    – He recorded and will annotate the session for further teaching, and closes with personal notes (birthday tomorrow) and well wishes.

  • ICT Price Action Chronicles – The Science Of Anticipation In Price Action

    ICT Price Action Chronicles – The Science Of Anticipation In Price Action

    https://www.youtube.com/watch?v=tByaPnk3fc4

    Summary:

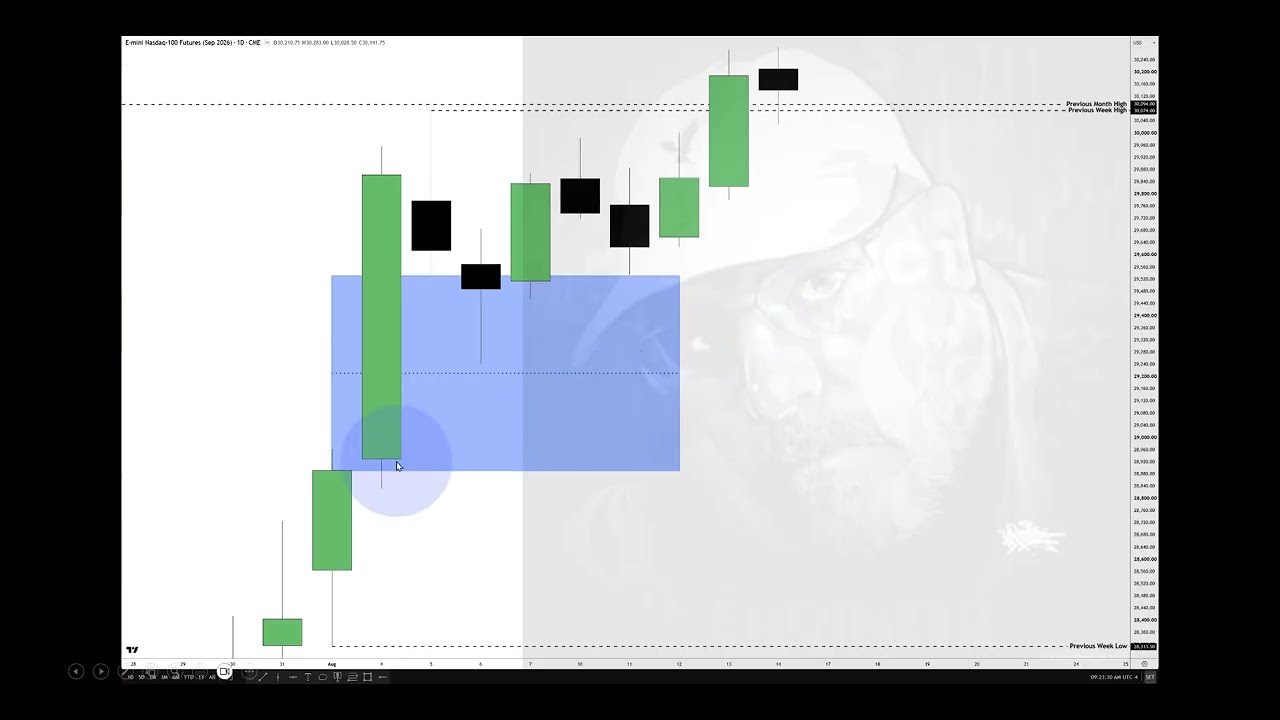
    The speaker reviews a strong post-FOMC rally and explains the technical reasons they entered a long trade, focusing on daily “inversion fair value gap” levels, volume imbalances, and a premarket suspension block on a one-minute chart. They describe the live entry at the midpoint of a gap, how they managed the trade (partial profit-taking and moving the stop to lock in gains), and the importance of watching whether price defends the upper half of the gap and closes above key wicks and prior highs. Practical trading advice includes using Monday–Wednesday mornings during non‑farm‑payroll (NFP) weeks for cleaner price action, preferring technical price‑action/supply‑demand analysis over fundamentals (which they view as unreliable for indices), and focusing on anticipation, pattern recognition, and disciplined risk management. They emphasize: set and keep measured stops, take partial profits to manage emotions, trade with probability by using daily key levels (PD arrays, gaps, volume imbalances), and build experience through consistent observation of price behavior.

  • ICT Price Action Chronicles – MOC Crushing The Buying & Selling Pressure Myth

    ICT Price Action Chronicles – MOC Crushing The Buying & Selling Pressure Myth

    https://www.youtube.com/watch?v=HFWqQelvrJw

    Summary:

    The speaker reviews an E-mini S&P Market‑on‑Close trade (Aug 4, 2026), using the prior day’s lecture as context and focusing on precise, repeatable price‑action methods rather than broad indicators. Key ideas:

    – Focus window: measure the full daily range (intraday high to low) and concentrate on the final hour (3:00–4:00 PM ET) and PM‑session structure (pre‑market 1:30–2:00 PM, then 3:50–4:00 PM) to find high‑probability, short-duration setups.
    – Tools and signals: use simple price‑action tools — measured range, anchored fibs (including negative .5), octant/16th splits, candlestick structure, fair value gaps, and volume imbalances — to calculate exact price levels and bias.
    – Trade logic: wait for price to rally into defined highs (liquidity pools/inefficiencies), then look for failure (rejection, fair‑value gap inversion, close below key levels) to enter a short; use partials and tight stops. Candlestick behavior and order‑flow rules validate direction.
    – Execution nuance: setups are surgical and time‑sensitive; small imperfections and manual intervention can occur. The instructor shows live execution but warns that publicizing exact stops/targets attracts other traders’ orders, which can undermine an edge.
    – Teaching stance and risk: the presenter will not provide live trade calls or one‑on‑one mentorship and stresses operator responsibility — students must practice, learn the process, and accept personal risk. The methods are presented as systematic, mathematical, and repeatable but require experience to use reliably.

  • ICT Price Action Chronicles – Market On Close Macro

    ICT Price Action Chronicles – Market On Close Macro

    https://www.youtube.com/watch?v=PP1-i0ti_tQ

    This is a trading lesson using the August 3, 2026 New York PM session to teach a short, repeatable intraday “market-on-close” (aka “murder on close”) scalping macro that often produces clean, predictable price runs in the last hour of regular trading. Key timing rules: set your clock to New York local time; the NY PM pre-session begins at 1:30 PM ET, 3:00 PM often produces a defining premium wick (PDA) and 3:50–4:00 PM is the critical 10-minute market-on-close window to watch. Method highlights: identify the last-hour high/low range, grade any wicks (wicks take precedence over adjacent fair-value gaps), spot relative equal highs/lows and minor sell-side/buy-side liquidity pools, then project the first-octant/0.5 fib level as a high-probability target (example target shown ~28,870.75). Risk and execution: anchor stop-losses near the 3:00 premium-wick high (upper-half context), allow measured drawdown into the wick, add to positions on expected tests, and use partials rather than obsessing over perfect exits. Trade psychology and process: expect losses and missed trades, backtest the rules, practice disciplined entries/management, and refine execution over time rather than chasing perfection.