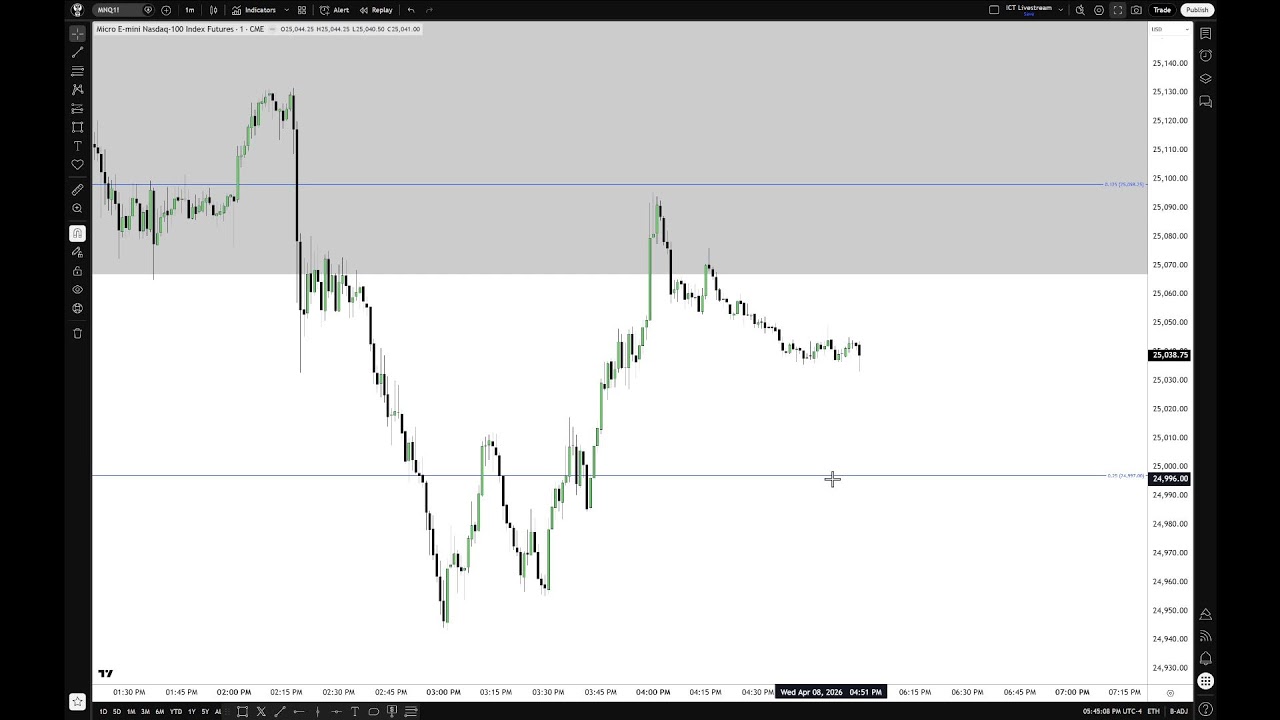
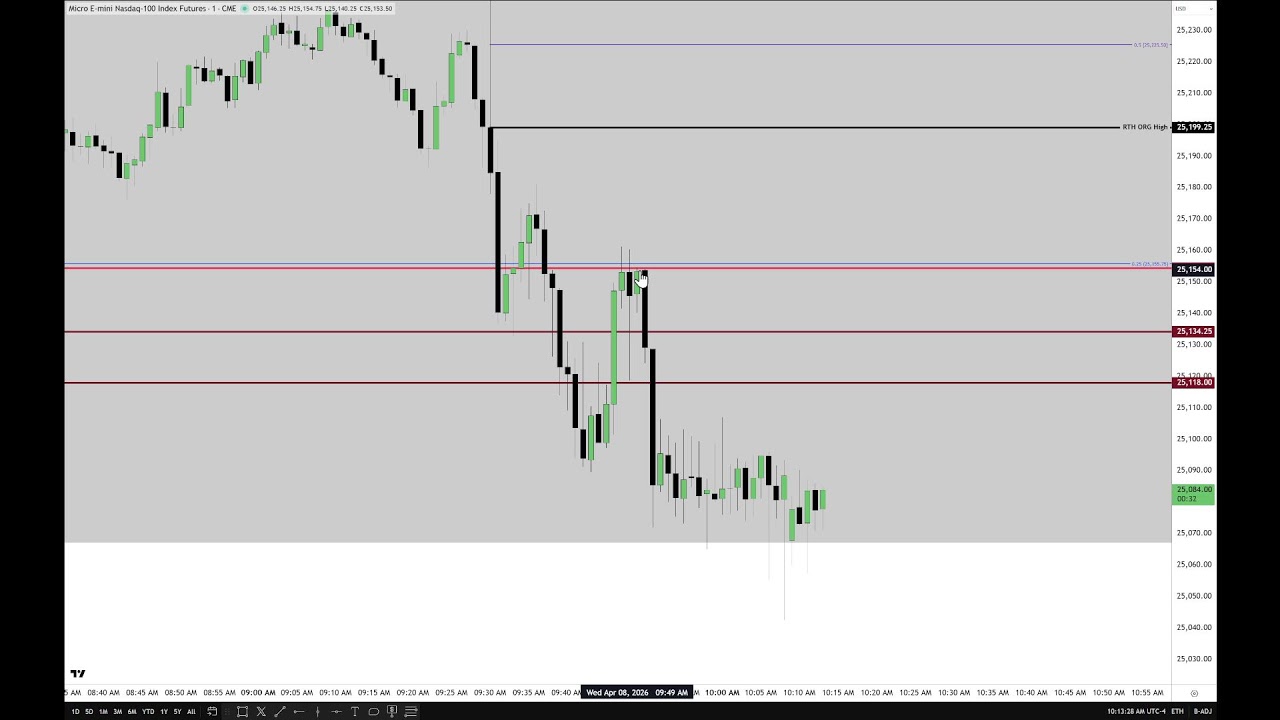
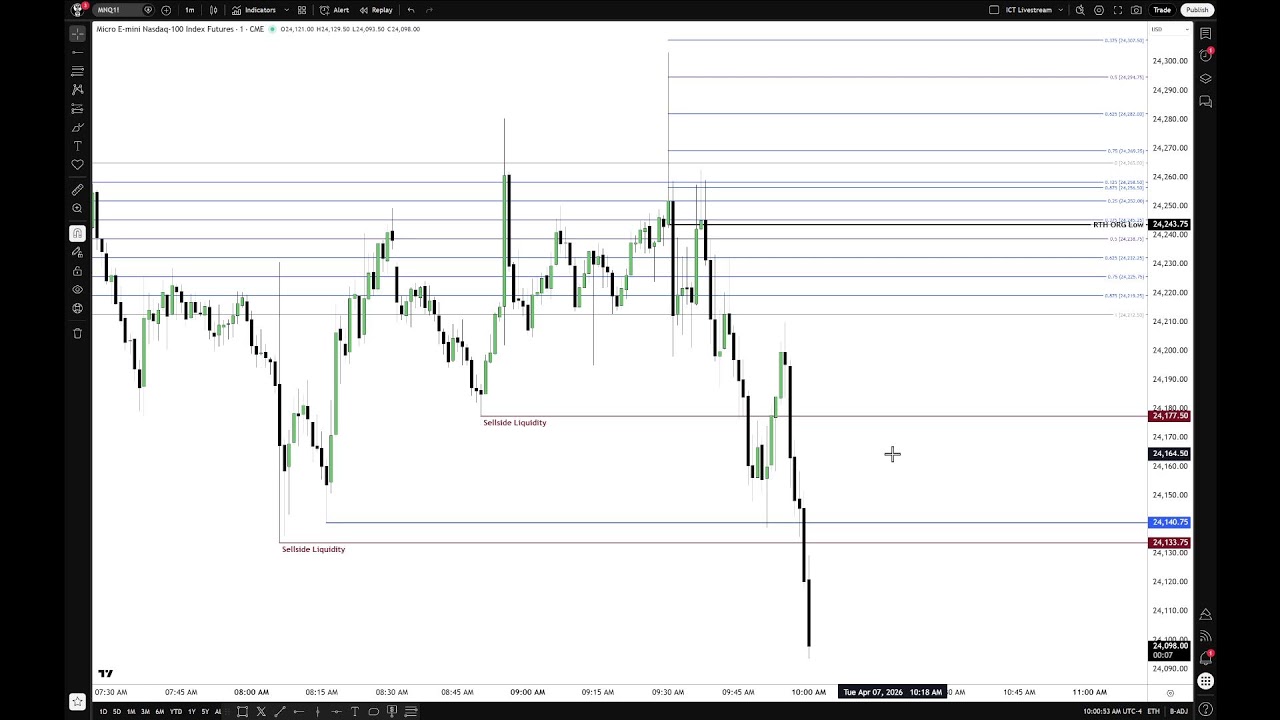
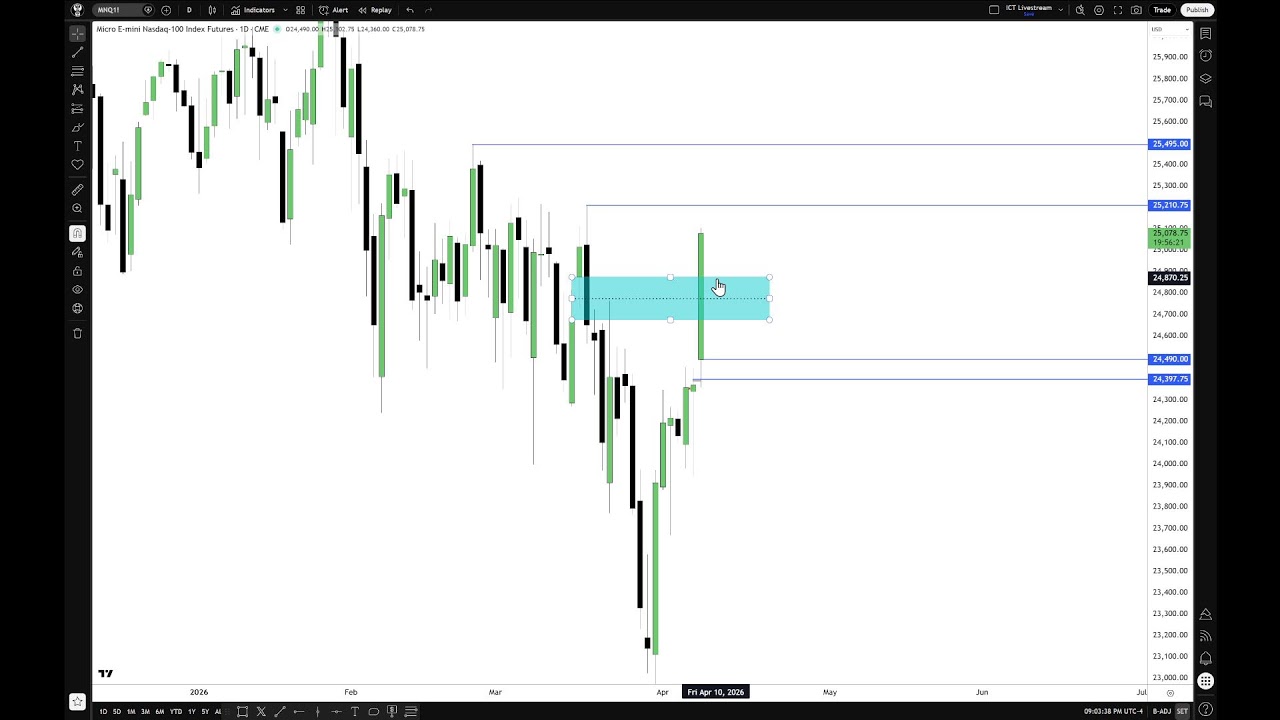
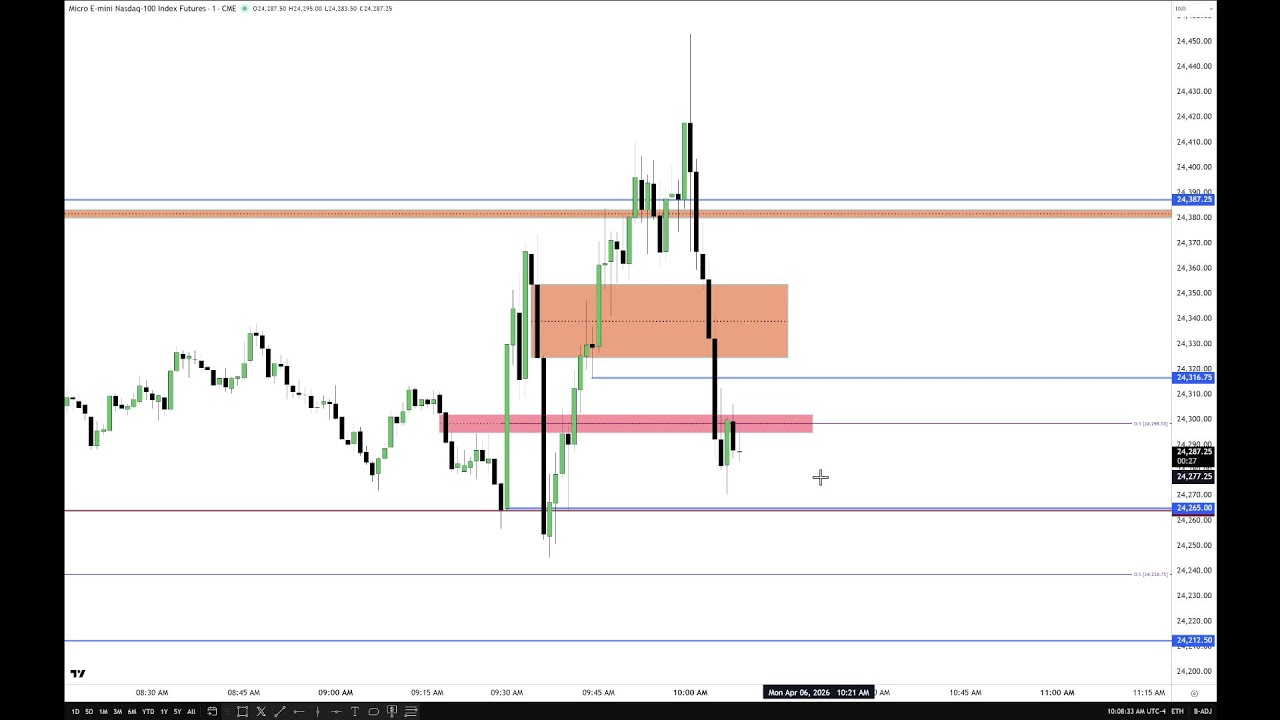
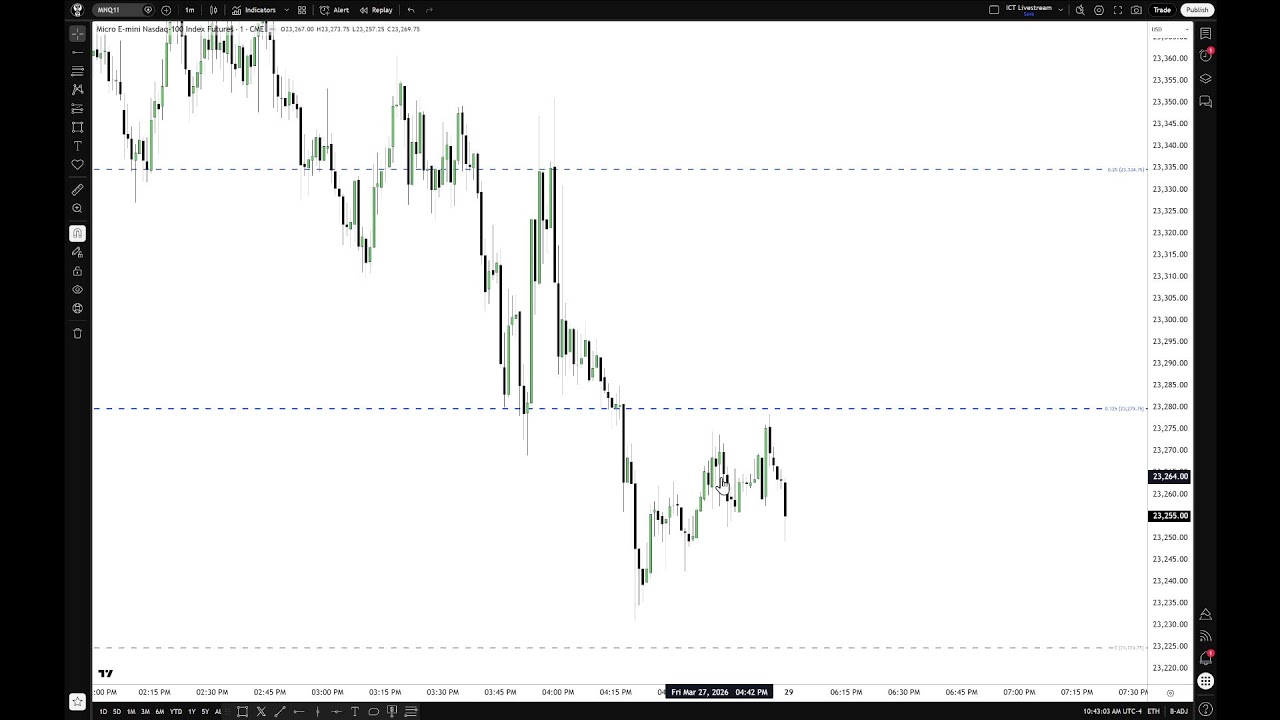
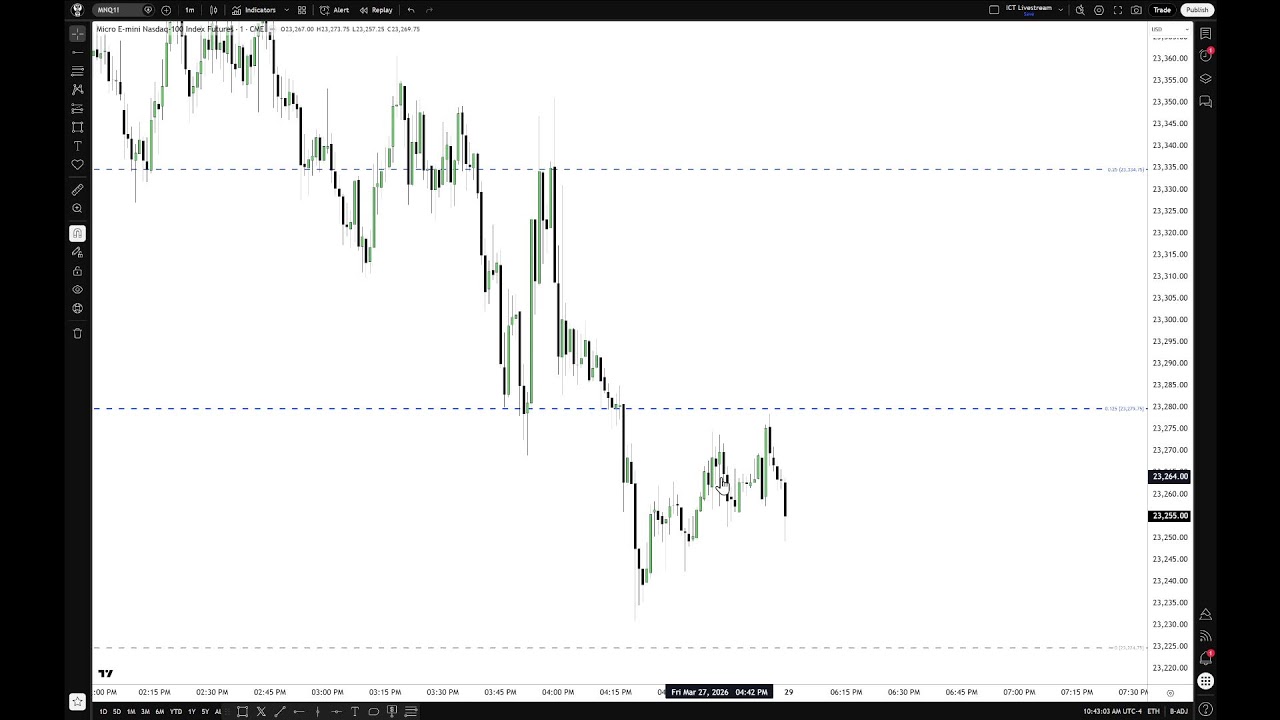
ICT gives a ~15-minute live review of the Micro Nasdaq (MNQ) price action, noting they may not stream tomorrow. He says viewers should also watch his earlier live stream because it explained the moves in real time.
Key technical points: a large regular-trading-hours opening-range gap formed after geopolitical headlines, price rallied into the midpoint of a daily “suspension block,” then fell to the block’s low (his target) and spent time trading in the lower half of that block.
He highlights a “fair value gap” (a buy-side inefficiency) and a recurring signature he uses: whether candlestick bodies — not just wicks — can touch key levels. Because the bodies failed to trade into the upper half of the suspension block (and could not touch certain levels), he interprets the structure as bearish and expects further downside unless price clears those levels at the next open.
He warns that off-hours geopolitical developments could change the picture at the 6:00 open, so be prepared. Practical advice: use less leverage, avoid overtrading, require stronger confluence before committing, be nimble and satisfied with partial runs. He closes noting family commitments and that he’ll post if he streams later.
Quiz
1. According to ICT, what is the key sign of bearishness when price retraces into a premium level? A. The wicks must touch the level B. The bodies cannot touch the level C. Price must close above the level D. Volume must increase
2. What did ICT say happens after price fails to get back up into the upper part of the daily suspension block? A. It becomes bullish B. It usually trades to consequent encroachment C. It immediately reverses to all-time highs D. It stops trading for the day
Answer Key:
1. B Evidence:“…if the bodies of the candlesticks can’t touch them… if the bodies can’t touch this key level while potentially being bearish… that’s bearish.” 2. B Evidence: “When it fails to get there, is that bullish or bearish? It’s bearish… I would look for that to eventually still try to work its way down to consequent encroachment right here
– ICT is focused on the micro NASDAQ this morning (despite FOMC minutes later) and watches one primary level: the low of a daily “suspension block” (shaded gray box) formed by a very large opening-range gap. – Key technical idea: price should draw to that low; if it breaks below, intraday retracements must stay in the lower quadrant (not reclaim the midpoint) for bearish continuation. Several downside targets were hit already. – Trading posture: be cautious — ICT would protect stops, take partial profits, and avoid overtrading. This commentary is observational, not trade advice. – Market context: volatility is amplified by geopolitical headlines and possible misinformation; that increases range and manipulation, so expect larger moves and be conservative. – Methodology emphasized: simple tape-reading (open/high/low/close, liquidity and inefficiencies) is sufficient — no complex indicators, footprint, or social-media hype needed. – Practice advice: watch live price action or record your screen, study individual one-minute candles, keep a study journal of expectations and emotions, and paper-trade consistently for 6–8 weeks before scaling up. – Psychological guidance: manage ego, fear, and overconfidence; learn to stop when you’re disciplined and “be content with enough.” Avoid chasing vanity metrics on social media. – Bottom line: focus on a few clear levels, practice disciplined tape-reading, protect capital, and develop emotional control — simplicity and repetition are the fastest path to consistent progress.
Quiz:
1. What did ICT say about using market replay instead of live recorded price action? A. It is better than live recording because it shows every tick B. It is the best method for learning order flow C. It is less useful because it only gives two updates per candle D. It should be used exclusively instead of tape reading
2. What did ICT recommend as a starting exercise for developing traders? A. Trade multiple contracts in a live account immediately B. Watch live price action and learn where the market is likely to draw to C. Use Elliott Wave and footprint charts first D. Focus on social media trade calls and copy them
3. What did ICT say about having a plan B in trading? A. Plan B is necessary for every setup B. Plan B helps reduce emotional pressure C. There should be no plan B, because it creates a scheduled exit to quit D. Plan B is only for demo accounts
Answer Key:
1. C — “market replay… it only seeing how it opens with a little bit of a flurry price action and then in the last little bit of movement. So, it’s only two updates to every new candle” 2. B — “The first rule of engagement… is to know where it’s likely to go to… you have to submit yourself to watching these individual candlesticks” 3. C — “There cannot be plan B. Okay? There’s no plan B… You just scheduled the exact premise why you’re going to quit and then fail.”
– ICT opened a livestream before the market open warning of unusually high risk and volatility today due to an anticipated geopolitical event tonight (creates bearish sentiment), so he’s staying neutral and observing rather than trading. – He repeatedly cautioned viewers not to use his real-time comments as trade signals — any winning moves today are likely chance/lottery-like; inexperienced traders should stay on the sidelines. – Market action: overnight and opening-range price behavior was messy (wicks, gaps, fair-value inefficiencies). The market took buy-side liquidity first (stopping shorts), then some sell-side moves — overall unclear and hard to read. – Technical focus: regular trading hours opening-range gap levels, liquidity pools, and recent wicks are key; price has been trading inside yesterday’s opening-range structure and lacked conviction one way or the other. – Teaching points: the session was treated as tape-reading practice — build anticipatory skills, learn to read market narrative (how stops and traps are engineered), and accept uncertainty rather than forcing trades. – Emphasis on risk management and experience: protect capital, avoid trading from fear or FOMO, don’t expect guarantees from teachers, and develop skill through disciplined observation and practice rather than rushed trading.
A live trading mentorship session led by Michael (ICT) with host Kitt and several students asking questions and sharing observations. The focus was on tape reading, intraday models, and trader psychology.
– Core trading guidance: – Tape reading and observing live price action are essential. Michael repeatedly recommends spending weeks/months just watching price (no trading) to build pattern recognition and emotional resilience. – Emphasize the first 30 minutes of the regular session (two 15‑minute intervals/opening range) as high‑value for finding expansions and trade opportunities. – Toggle the settlement/contract view on/off to find which setting reveals the most recent volume imbalances — use the setting that shows the relevant inefficiency. – Fair value gaps: only treat a fair value gap as valid after the candle that forms it closes; the gap’s presence before a high/low is the important signal. – Top‑down analysis is recommended (monthly → weekly → daily → shorter TFs), but most actionable intraday work can be done inside 15‑minute and lower timeframes. Lower TFs provide many practice opportunities but require faster decision-making.
– Risk & execution advice: – In current elevated/uncertain markets, dial back trading frequency and leverage; adapt to greater volatility and potential manipulation. – Recommended progression: ~2 months of focused tape reading, then ~2 months of demo trading before taking live trades. – Favor process over money: disassociate trades from dollar outcomes, focus on consistent inputs and simple rules.
– Psychology, consistency & journaling: – Patience, rule-following, and consistent daily practice are key. Many traders fail by rushing for profits, trading with emotion, or skipping deliberate observation. – Journal feelings and decisions; analyze emotional triggers (fear, greed, pride) to avoid repeating harmful behavior. – Progress over perfection — small consistent gains compound; avoid hunting for single big wins.
– Personal reflections: – Michael shared candid life lessons about money, relationships, and how monetary success can distort self‑worth and attract/enable toxic dynamics. He stresses safeguarding personal values and choosing relationships not based on wealth. – Other students shared real examples of drawdowns and recovery, reinforcing the need to slow down, return to core protocols, and rebuild discipline.
– Practical takeaway: simplify the workflow (top‑down to identify barriers, then focus on the opening range/first 30 minutes and tape reading), prioritize non‑monetized learning first, journal, and cultivate patience and consistent habits before increasing risk.
Quiz
1) According to ICT, what is the main reason he toggles the chart setting on and off when looking at continuous contracts? – A. To hide expired contract data from students – B. To find the setting that shows the most recent volume imbalance – C. To reduce chart clutter for presentation – D. To compare daily and weekly moving averages
2) What did ICT say is the best way to learn before taking live trades? – A. Jump straight into live trading with small size – B. Spend at least a month tape reading, then two months demo trading – C. Use market replay until you can predict every candle – D. Trade only during news events to gain experience quickly
3) When discussing fair value gaps, what did ICT say matters most? – A. The gap must appear after the high is taken – B. Candle three must close to confirm the fair value gap – C. The gap must be on a weekly chart to be valid – D. Only wick-to-wick gaps count, not body gaps
4) What did ICT say about lower timeframes versus higher timeframes? – A. Lower timeframes always move faster in price – B. Higher timeframes are the only valid way to trade – C. Lower timeframes require more decisions and adjustment, but are useful for learning – D. Lower timeframes should never be used by new traders
5) What advice did ICT give about relationships and money? – A. Money should always be shared immediately to prove trust – B. You should use money to test whether someone really loves you – C. You cannot buy love or pay for friendship – D. Being wealthy guarantees healthier relationships
Answer Key:
1) B Evidence: “I’m looking for those volume imbalances… What I’m looking for is the one setting that has the volume imbalance is showing in most recent price action.” [00:13:00-00:14:00] 2) B Evidence: “For at least a month minimum. But I think two months is, is appropriate. Not even trying to take a demo account… Then you gotta do about two months of demo trading…” [00:39:36-00:40:30] 3) B Evidence: “Candle three has to close for you to have the fair value gap there.” [00:16:38-00:17:00] 4) C Evidence: “The lower the timeframe, the more requirement for you to make decisions and, and move and, and adjust.” [01:06:43-01:07:30] 5) C Evidence: “You can’t pay for friendship and you can’t buy love.” [01:37:00-01:37:30]
ICT is hosting a live market-watch on a high-risk “D‑day/T‑day” with a major geopolitical event expected later. He issues a strong disclaimer: he’s neutral, likely to be wrong today, and anyone using his commentary as trade confirmation should avoid risking real money. Price action this morning is messy and dangerous — the market opened, ran buy‑side first (likely stopping out shorts and breakout buyers), then showed weak/uncertain selling, lots of wicks, gaps and inefficiencies around the regular‑trading‑hours opening‑range levels. That makes reads difficult and trading hazardous.
Key takeaways: – Today is high‑risk and not a day for confident trading; sideline if you’re uncertain. – The market appears engineered to create stops/traps (ran the buy side first despite bearish sentiment). – Focus on observing price, tape, and levels (opening range gap, wicks, inefficiencies) rather than forcing trades. – Developing anticipatory price‑action skills takes hands‑on experience and discipline; no teacher can guarantee profitability. – If you must trade, be very conservative with stops and acknowledge the elevated chance of randomness/“lottery” outcomes.
Quiz
1. What did ICT say about taking trades during this morning’s live stream? A. He encouraged viewers to trade aggressively B. He said it was a good day to scalp quickly C. He warned viewers not to use his commentary as confirmation to take a trade D. He said the market was too predictable to avoid trading
2. How did ICT describe the market conditions for the morning?
A. Clean and highly predictable
B. Dangerous and likely to be messy
C. Calm with low risk
D. Strongly bullish with clear conviction
3. What was ICT’s overall bias for the morning?
A. Strong bullish bias
B. Strong bearish bias
C. Neutral bias
D. No opinion because he was not watching the market
4. What did ICT say the market did first after the opening bell?
A. Took sell-side liquidity first
B. Took buy-side liquidity first
C. Broke down and stayed below the opening range gap
D. Consolidated without taking any liquidity
5. What did ICT say new traders should do in a difficult environment like this?
A. Trade every move to gain experience quickly
B. Wait for a better setup and protect themselves by observing
C. Use higher leverage to maximize returns
D. Focus only on news headlines
Answer Key: 1. C Evidence: “please don’t do that today. I’m probably going to be wrong today. I’m probably going to get all wrong today. So, just bear that in mind.” 2. B Evidence: “I just don’t expect it to be clean price action. It’s probably going to be dangerous.” 3. C Evidence: “So, I have no bias this morning.” 4. B Evidence: “So far, we have taken a buy side and a sell side. Buy side’s taken first.” 5. B Evidence: “you have to learn what it is that’s going to hurt you” and “just sit and watch. Take the information in. Read the price action. Read the tape.”
– ICT: giving market interpretation after a major geopolitical move (Trump/Pakistan/Iran) that jolted markets after U.S. hours. – Geopolitical thesis: Administration reportedly delayed strikes (two-week pause/ceasefire conditional on Iran opening the Strait of Hormuz). ICT speculates this may be a deliberate tactic to let civilians leave announced targets, then strike later — a temporary lull, not a true de-escalation. – Market reaction: massive volatility overnight — crude plunged (quoted ~$109 to ~$91), stock index futures spiked, enormous single-minute price swings in futures (hundreds of handles). These moves occurred in off-hours and surprised many traders. – Primary warning: markets are now highly event-driven and manipulable. If you’re inexperienced, undercapitalized, over-leveraged, or trade without stop losses, you risk catastrophic losses. Treat this year as an education year if unsure. – Trading stance: speaker remains structurally bullish on crude long-term but expects continued violent, unpredictable swings. He is personally hands-off for now and plans to stop live tape-reading/streaming and shift to educational content to avoid influencing others into risky trades. – Technical notes (brief): many instruments show price inefficiencies/volume imbalances and potential reclaimed fair-value gaps; watch whether retracements respect the “upper half” of those ranges. Dollar, EUR, GBP, indices, gold, and silver are all disorganized and sensitive to events. – Practical advice: remove risk (demo/training), use stop losses, don’t chase highlight reels or social-media bragging. Expect more volatility tied to news cycles and overnight sessions; be cautious about trading around geopolitical headlines. – Personal/ethical note: market moves are tied to real human suffering; this makes trading emotionally difficult. The speaker urges prudence and empathy, and will return to live trading only when conditions make sense.
Summary: acute, event-driven volatility from geopolitical developments has created high-risk trading conditions. The speaker cautions inexperienced traders to stay out or study, uses technical observations to outline possible scenarios, and will step back from live trading to focus on education.
Quiz:
1) What did ICT believe was happening with the two-week ceasefire idea? A. It was guaranteed to end the conflict immediately B. It was mainly a way to buy time and let people move away from target areas C. It was meant to lower gold prices D. It was only about reopening stock exchanges
Answer Key:
1) B Evidence: “Think about what 2 weeks does. 2 weeks can lull someone into thinking that they got plenty of time.” and “they gave an a reason to to let the people go home and get away from those targets.”
– Logistics: Host apologized for oversleeping, noted YouTube translation delays, and joked about dogs distracting him during the stream.
– Trading approach and tools: He emphasizes trading visual order-flow concepts—inefficiencies, fair value gaps (FVGs), wicks, PD arrays, octants/quadrants—and prefers watching bodies vs. wicks, using higher timeframes (5-min vs 1-min) to clear “time distortion.” He criticizes black‑box indicators and level‑2/footprint reliance, urging traders to learn real price mechanics.
– Short-term trading stance: Current market conditions are volatile and manipulated; he recommends surgical, short-duration trades or sitting out. He won’t teach aggressive “one-shot, one-kill” approaches until conditions return to being more predictable.
– Macro calendar and risk: CPI/PPI and Fed minutes are imminent and likely market-moving. He warns these events produce quick, violent moves and advises strict risk management and low leverage.
– Market views (selected instruments):
– EUR/USD and GBP/USD: Trading within daily inefficiencies; bias to lower if price remains in the lower half of ranges, but chop could persist.
– NASDAQ / MNQ: Shows intra‑day manipulation signatures; opening‑range midpoint and FVGs are key reference levels.
– Crude oil: Bullish bias; expects event-driven volatility and possible stop‑cleaning moves before strong upward continuation.
– Gold/silver: Neutral-to-down until key PD arrays are taken out; would need clear breaks above specific levels to turn bullish.
– Grains/agricultural commodities: He expects these to be a major bullish theme later (months ahead) due to fertilizer/supply shocks—important to study as they affect real demand.
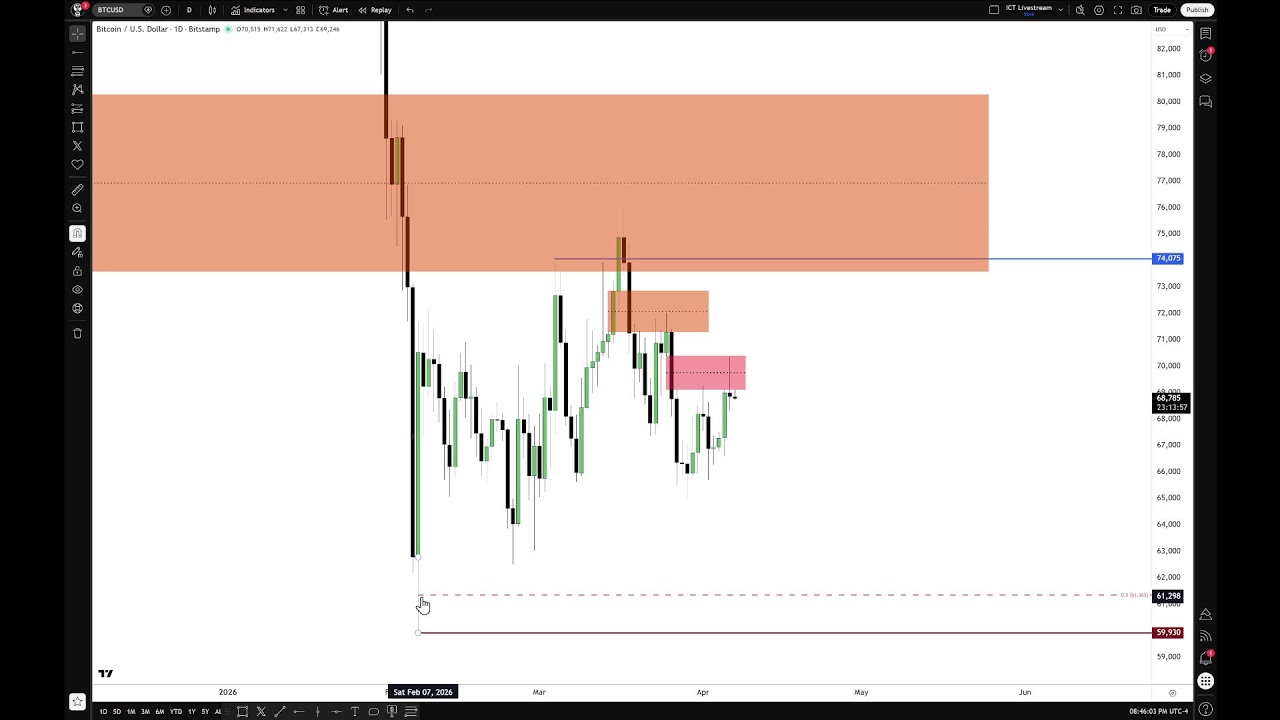
– Bitcoin/crypto: He is skeptical of crypto’s long-term value and states a personal bearish view (even extreme calls like “to zero”) and is not actively trading it.
– Broader themes & warnings: Expects 2026 to be a particularly difficult trading year with increased manipulation and severe drawdowns for ill-prepared traders. Recommends preparing households (supplies) as macro shocks could be severe. Cautions against hyped social-media traders and easy-money narratives.
– Tone and closing: Stern, precautionary advice—protect capital, be selective, study institutional order‑flow logic. He hopes to be wrong about the worst-case scenarios but insists traders must plan for them.
1) What did ICT say about trading around CPI and PPI news? A. He likes to predict the exact move before the reports B. He avoids being ahead of the marketplace on those reports and waits for the market to reveal its direction C. He ignores the reports completely and never trades afterward D. He says CPI and PPI are always bullish for all markets
2) What did ICT say about crude oil’s likely direction? A. He expected crude oil to go lower immediately B. He thought crude oil was likely to go higher C. He said crude oil had no clear technical setup D. He said crude oil would remain flat for months
Answer Key: 1) B Evidence: “I don’t care about the data. I don’t care where it’s going to go. I’m just thankful it’s going to go somewhere. And then after a few minutes, then I’ll go in and I’ll start looking for setups…”the market will continue moving lower.”
2) B Evidence: “So we have higher prices in order for crude oil. I think it’s it’s very tricky for like doing short-term trading… I’d be looking for a lot of shenanigans, a lot of manipulation… but I would like to see it… go higher.”
This was a market-focused live commentary. Main points:
– Dollar index: currently consolidating. ICT is short-term bullish as long as the “suspension block” (key support/volume-imbalance area) holds; a break below it would invalidate that view and point lower. – Euro: stuck in a tight range and struggling; bodies remaining in the lower half would favor a move toward prior lows. Pound: showing stronger downside behavior; a daily close above its recent high would negate the bearish bias. – Indices (MNQ/NQ/MES): watching opening-range behavior, gaps, buy/sell-side liquidity and fair-value gaps. The presenter is re-acclimating after time away, so will watch price action for a few days rather than force trades. Emphasis on tape-reading, not chasing breakouts, and using specific levels (opening price, gap midpoints, consequent encroachment) to judge direction. – Crude oil: could rally sharply (targets discussed up to $175–$200/bbl) if upcoming geopolitical/news actions occur. – Metals: gold is bearish while below its key level; silver is in “no-man’s land”—neither a clear buy nor sell; advised to avoid trading it. – Overarching theme: markets feel manipulated right now (“Tomfoolery”) with political/social-media-driven catalysts creating skittish, messy price action. Advice: be cautious, avoid heavy leverage or forced trades, and inexperienced traders should consider sitting out until price action cleans up. – Operational notes: speaker was off-market for a week, will ease back into live analysis, and flagged time/translation constraints on the stream.
Bottom line: pay attention to the highlighted support/resistance, volume imbalances and fair-value-gap levels; stay cautious and observe opening-range signatures before trading in this volatile, manipulated environment.
Quiz
1. What did ICT say he would do if he were a brand-new trader with less than a year or two of experience? A. Trade every market aggressively B. Take the first half of the year off, and avoid summer trading C. Increase leverage to learn faster D. Focus only on silver futures
Evidence: “If your experience level is less than a year or maybe even two, maybe maybe take the first half the year off… don’t do anything in the summertime.”
– Opening: livestream with background noise; speaker explains teaching style is progressive and based on decades of experience.
Market outlook (high-level):
– US dollar: bullish; expects higher dollar index (target ~101.97).
– EUR/USD and GBP/USD: bearish — price structure, volume imbalances and fair-value gaps point to further downside.
– Crude oil: would be very bullish if it gaps up and holds separation, but market is manipulated and risky.
– Bitcoin: speaker is strongly bearish (expects much lower prices; personally believes it could go to zero).
– Gold & silver: bearish near- to mid-term targets; silver manipulation helped accelerate drops; has 6‑month downside objectives.
– Copper: watching lows as a potential opportunity.
– Equities (Dow, MES, NASDAQ/MNQ): bearish — speaker outlined first-half-of‑year downside objectives for major indices.
Key technical themes and concepts:
– Uses volume imbalances, (inversion) fair-value gaps, “consequent encroachment,” buy/sell-side liquidity pools and body-vs-wick behavior to read order flow and market intent.
– Repeated patterns and signatures (e.g., bodies staying in lower half of a range, failure to reach consequent encroachment) indicate bearish continuation; reclaimed/inversion fair-value gaps signal important shifts.
Trading methodology and lessons:
– Introduces the “first hour’s dealing range” (9:30–10:30 ET) as a practical algorithmic reference: use its midpoint, octants/quadrants and projected range to anticipate lunch‑time macros and PM session direction.
– Practical rules: prefer trading the first fair-value gap after the first-hour range is broken; manage risk with dynamic trailing stops (e.g., above the highest high of the last three candles) and use partial exits; use 25/75% fib octant levels to scale or lock profits.
– Emphasizes paper trading, risk-management, and avoiding over‑leveraging; warns against treating his commentary as personal trade advice.
Other notes:
– Warns the market is heavily manipulated/algorithmic; urges skepticism and careful testing.
– Requests viewers not to post real-money screenshots; offers to run a backtesting/logging series for beginners.
Market views and targets – Dollar index: bullish; expects higher, with a minor buy-side run toward ~101.97 as an upside objective. – EURUSD / GBPUSD: bearish bias; price structure and fair-value gaps point to continued downside. – Crude oil: would be very bullish if Sunday/Monday gap opens above the 50% fib, leaves the gap, then rips higher — a scenario he’s watching, not recommending as a trade. – Bitcoin: strongly bearish view (ICT’s opinion: long-term collapse to zero); near-term expects lower prices unless short-term highs are decisively reclaimed. – Gold and silver: bearish near-term; volume imbalances and inversion fair-value gaps argue for a rapid selloff to stated targets (first-half-of-year objectives). – Equities (Dow, S&P, NASDAQ/MNQ): bias lower with defined first-half (six-month) downside objectives; some intraday targets already met.
Core trading concepts taught – Volume imbalances / inversion fair-value gaps: use gaps and imbalances as support/resistance; when treated as inverted they can accelerate moves. – Consequent encroachment and wicks vs. bodies: bodies staying in the lower (or upper) half of a range indicate directional bias; wicks do “damage” (stop runs) while bodies show the narrative. – Reclaimed (bearish/bullish) fair-value gap: once price closes through a fair-value gap, it can become reclaimed and used as bias confirmation. – Buy/sell-side liquidity pools: identify where stops/liquidity is concentrated and watch for stop hunts.
– First hour’s dealing range (key practical lesson): define the range from 9:30–10:30 ET — not the 30-minute “opening range” – uses the first-hour range to forecast afternoon direction. – Fibonacci octants/quadrants on first-hour range: project intra-day reaction levels; many moves respect those subdivisions. – In a trending day, after we have broken 1st hours dealing range. Look for the 1st presented FVG after it is broken, thats the one you want to sell on -Project the range 1 standard deviation lower and that is your target in a perfect world. – Add octants to the projected range
– Trailing stops and risk management: trail stops above the high of the last three candles (or use 25%–75% fib slices of a projected range) to lock profits and limit drawdowns. Dont do this every trade
– Trading psychology & risk warnings: paper-trade these methods first; don’t overleverage, avoid treating commentary as hard trade advice, beware holiday/low participation volumes and manipulation.
Practical recommendations
– Re-watch the live-stream segments (first hour, Trader Roundup recordings) for the real-time teaching examples.
– Backtest and log observations; he offers to run a week-long backtest/how-to series if there’s interest.
– Paper trade new methods; be conservative with real money and avoid emotional overleverage.
Tone and context
– Strongly opinionated style with frequent warnings about market manipulation and trolling; live-stream had household noise in the background (noted repeatedly).
Quiz
1) According to ICT in the transcript, what was his directional bias for the dollar index versus Euro and Pound? A. Bearish on dollar; bullish on Euro and Pound B. Bullish on dollar; bearish on Euro and Pound C. Neutral on dollar; bullish on Euro and Pound D. Bullish on dollar; bullish on Euro and Pound
2) ICT describes a close below “consequent encroachment” on a Eurodollar candle as most indicative of what? A. A higher probability of price continuing higher B. A higher probability of price continuing lower C. Market indecision and likely sideways action D. Immediate reversal to previous high
3) What time window does ICT define as the “first hour’s dealing range” (Eastern Time)? A. 9:00–10:00 ET B. 9:30–10:30 ET C. 10:00–11:00 ET D. 11:30–12:30 ET
4) What probability did ICT give that price will attempt to reach the midpoint of the opening-range gap in the first 30 minutes? A. 30% likelihood B. 50% likelihood C. 70% likelihood D. 90% likelihood
5) What trading practice does ICT explicitly recommend listeners follow when using his commentary? A. Trade with maximum leverage on live accounts B. Only trade his signals with real money C. Paper trade his ideas rather than risking real money D. Use his commentary to ignore risk management
Answer Key: 1. B Evidence: “I’m bullish on dollar and I’m bearish on Euro dollar and pound dollar.”
2. B Evidence: “we close below consequent encroachment, which is indicative of a continuation. It just means it’s much more probability that it’s going to go in this direction lower.” (transcript)
3. B Evidence: “So, we’re going to go back to 10:30, which is your first hours dealing range… all I’m doing is moving this around until I see 10:30 a.m. at the bottom of the chart… So, there’s your first hours range.” (transcript; references to 9:30 open and 10:30)
4. C Evidence: “Always anticipate the likelihood because there’s a 70% likelihood that it’s going to try to get to the midpoint of that opening range gap.” (transcript; referencing 9:30–10:00 opening range)
5. C Evidence: “Paper trading is what you should be doing. If you’re listening to me, just paper trade. If you do it with real money is extremely uncomfortable for me…” (transcript)