Author: Summarizer

  • How New Students Should Start Part 4 \ Pillars Of Daily Log Entries

    How New Students Should Start Part 4 \ Pillars Of Daily Log Entries

    https://www.youtube.com/watch?v=L81eMQhmXmc

    This video gives a simple, practical six‑week routine for new students to build pattern recognition in price action by daily logging three repeatable phenomena. Key points:

    Purpose and approach
    – Don’t try to learn everything at once. Focus on a few repeatable tasks, build habit and sample size, then backtest later.
    – Spend ~20 minutes/day, take screenshots and annotate neatly. Keep electronic notes if possible. Study past ~6 weeks and continue forward to build a 12‑week sample (start with NASDAQ if unsure).

    Three daily pillars (use 1‑minute charts)
    1) Pre‑market phase (7:00–9:00 AM ET)
    – Draw vertical lines at 7:00 and 9:00, record the highest high, lowest low, and any relative equal highs/lows.
    – Note whether price is trending or consolidating in that window; this often foreshadows behavior after the 9:30 RTH open.

    2) Regular Trading Hours (RTH) opening‑range gap
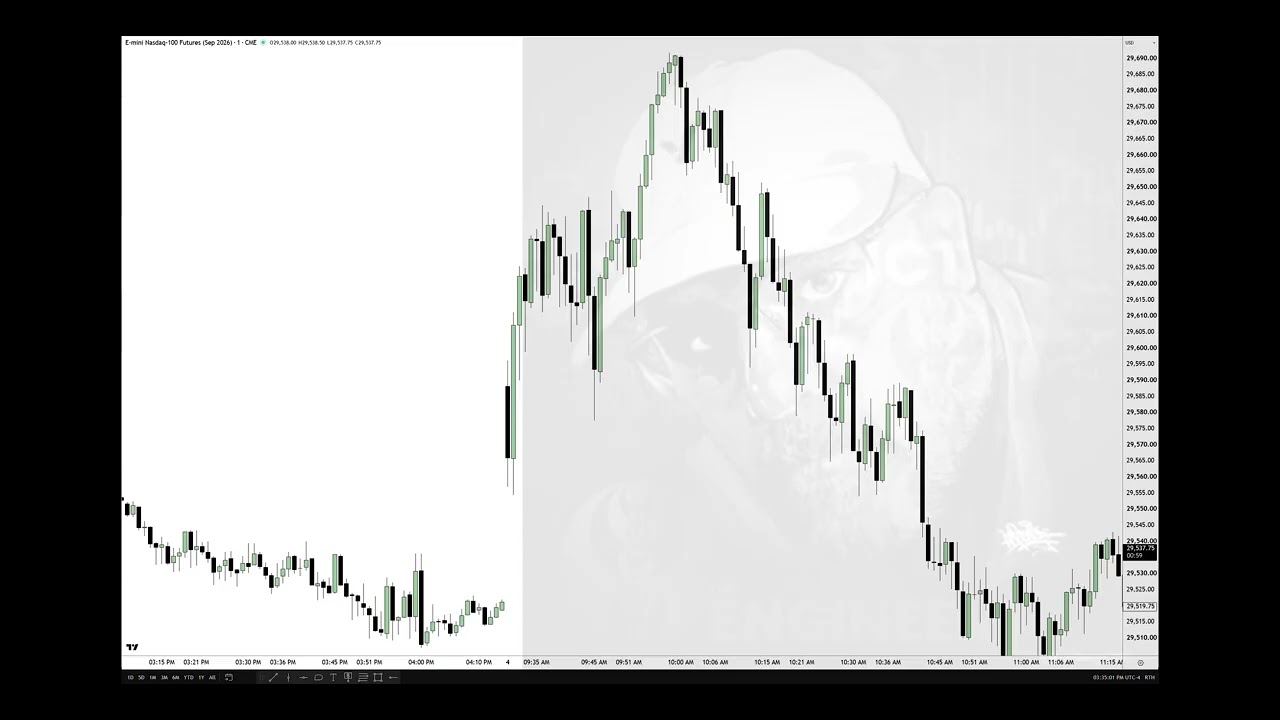
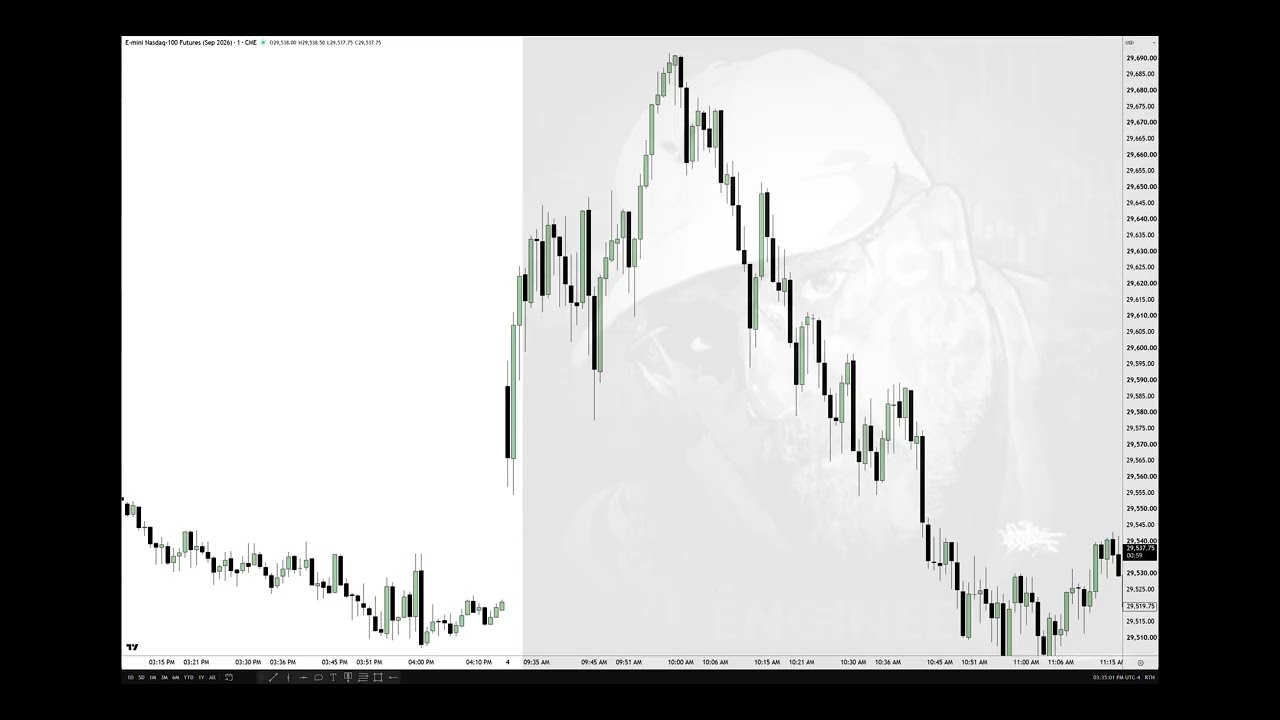
    – Toggle RTH on the chart, draw a rectangle from prior close (4:14 PM ET) to the new open (9:30 AM).
    – Use the rectangle’s midpoint (inefficiency) and log if/when price encroaches it (often by ~10:00 AM). Track how often and how price reacts.

    3) First fair value gap after 10:00 AM ET
    – On the 1‑minute chart, identify the first fair value gap that forms at/after 10:00 AM, extend and log when price returns to it and the subsequent move.
    – Record times, ranges (handles), and outcomes.

    Execution and mindset
    – Start with one pillar for two weeks, add a second for weeks 3–4, then the third for weeks 5–6. Consistent daily logging builds recognition, discipline, and confidence—avoid system‑hopping. Review screenshots on non‑trading days to catch missed details.

  • How New Students Should Start Part 4 \ Pillars Of Daily Log Entries

    How New Students Should Start Part 4 \ Pillars Of Daily Log Entries

    https://www.youtube.com/watch?v=L81eMQhmXmc

    This video gives a simple, practical six‑week routine for new students to build pattern recognition in price action by daily logging three repeatable phenomena. Key points:

    Purpose and approach
    – Don’t try to learn everything at once. Focus on a few repeatable tasks, build habit and sample size, then backtest later.
    – Spend ~20 minutes/day, take screenshots and annotate neatly. Keep electronic notes if possible. Study past ~6 weeks and continue forward to build a 12‑week sample (start with NASDAQ if unsure).

    Three daily pillars (use 1‑minute charts)
    1) Pre‑market phase (7:00–9:00 AM ET)
    – Draw vertical lines at 7:00 and 9:00, record the highest high, lowest low, and any relative equal highs/lows.
    – Note whether price is trending or consolidating in that window; this often foreshadows behavior after the 9:30 RTH open.

    2) Regular Trading Hours (RTH) opening‑range gap
    – Toggle RTH on the chart, draw a rectangle from prior close (4:14 PM ET) to the new open (9:30 AM).
    – Use the rectangle’s midpoint (inefficiency) and log if/when price encroaches it (often by ~10:00 AM). Track how often and how price reacts.

    3) First fair value gap after 10:00 AM ET
    – On the 1‑minute chart, identify the first fair value gap that forms at/after 10:00 AM, extend and log when price returns to it and the subsequent move.
    – Record times, ranges (handles), and outcomes.

    Execution and mindset
    – Start with one pillar for two weeks, add a second for weeks 3–4, then the third for weeks 5–6. Consistent daily logging builds recognition, discipline, and confidence—avoid system‑hopping. Review screenshots on non‑trading days to catch missed details.

  • My Model On NQ NFP Friday

    My Model On NQ NFP Friday

    A live trading commentary where the speaker narrates a short intraday short trade and explains the thinking, strategy, and risk management. Key points:

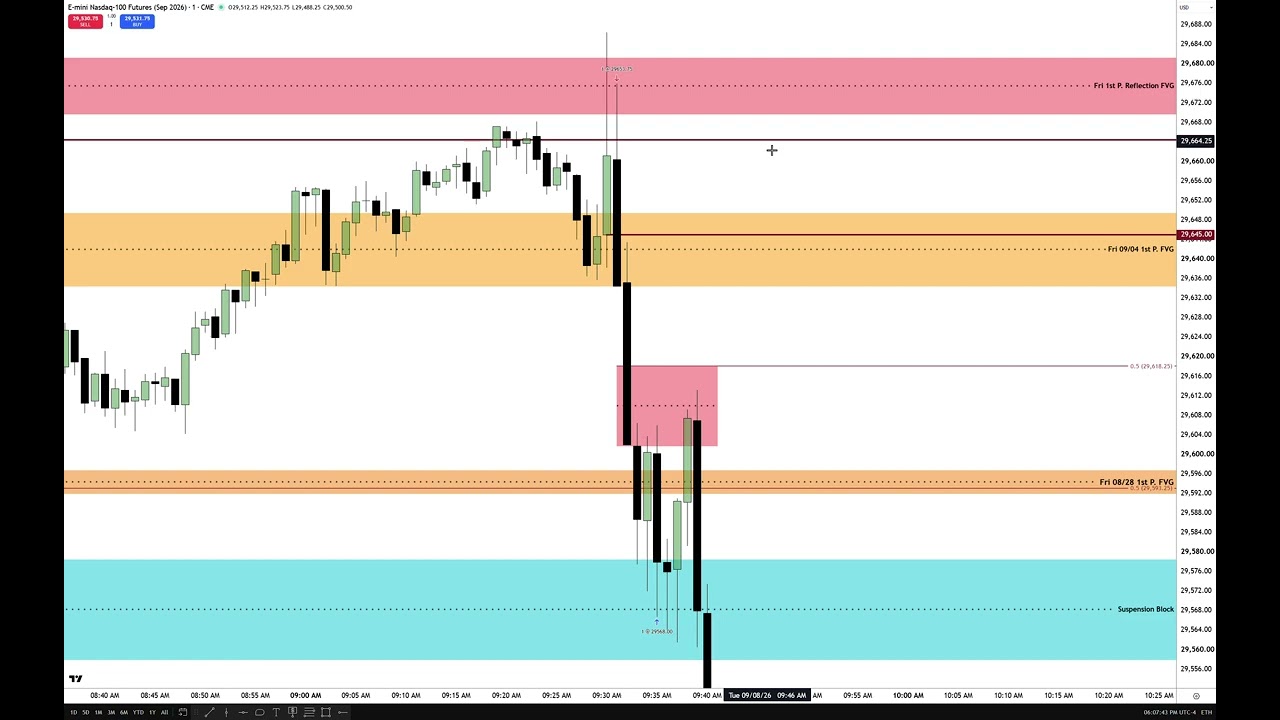
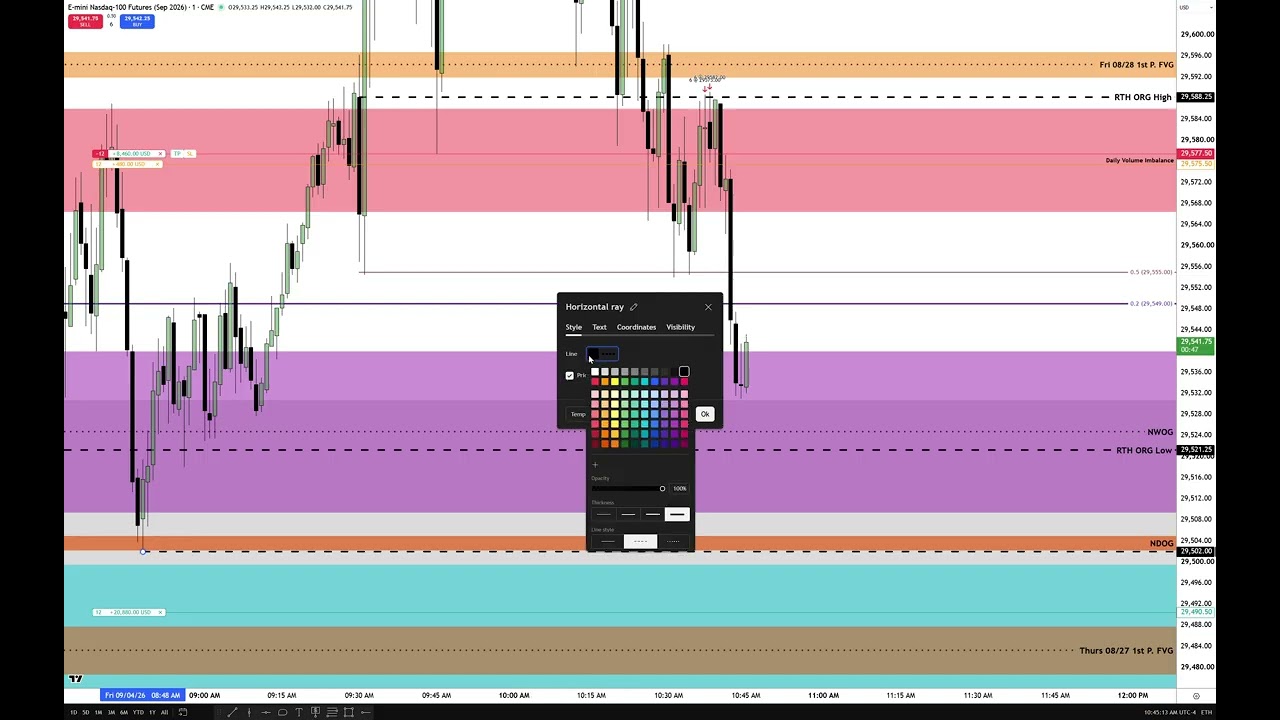
    – Market context: price traded into the day’s opening-range-gap high (9:30 open), which coincided with a daily buy-efficiency/volume area. The trader expected a sharp sell-off to take out the regular trading-hours opening-range gap low and the nonfarm-payroll (NFP) liquidity cluster just below ~29,500, aiming for about a 30% weekly-range retracement (~29,471).
    – Strategy/model: trading the “market maker” model — favoring second-stage distribution/redistribution sell setups (and second-stage reaccumulation for buys). References earlier mentorship material and chart models he teaches.
    – Execution and risk management: he positioned short, moved his stop down to lock profit as levels were met, took partial profits, and closed the remainder before his planned stop when action looked likely to hit it. Emphasizes being willing to be stopped out and not risking unrealized gains.
    – Trading tips and opinions: warns against using market replay for teaching (calls it a crutch), advises caution trading late in NFP weeks (avoid after 11:00 AM Wednesday ET), and highlights watching liquidity clusters, gap lows/highs, and volume imbalances.
    – Tone/closure: casual, humorous, and personal — he jokes about chart “gimmicks,” teases a planned lecture, and signs off for a four-day Labor Day weekend.

    Overall: a practical day-trade recap combining technical levels, a market-maker framework, disciplined stop/profit management, and behavioral advice about NFP-week risks.

  • Trading NFP Thursday High Resistance Liquidity Runs

    Trading NFP Thursday High Resistance Liquidity Runs

    https://www.youtube.com/watch?v=xpH0wDANtmM

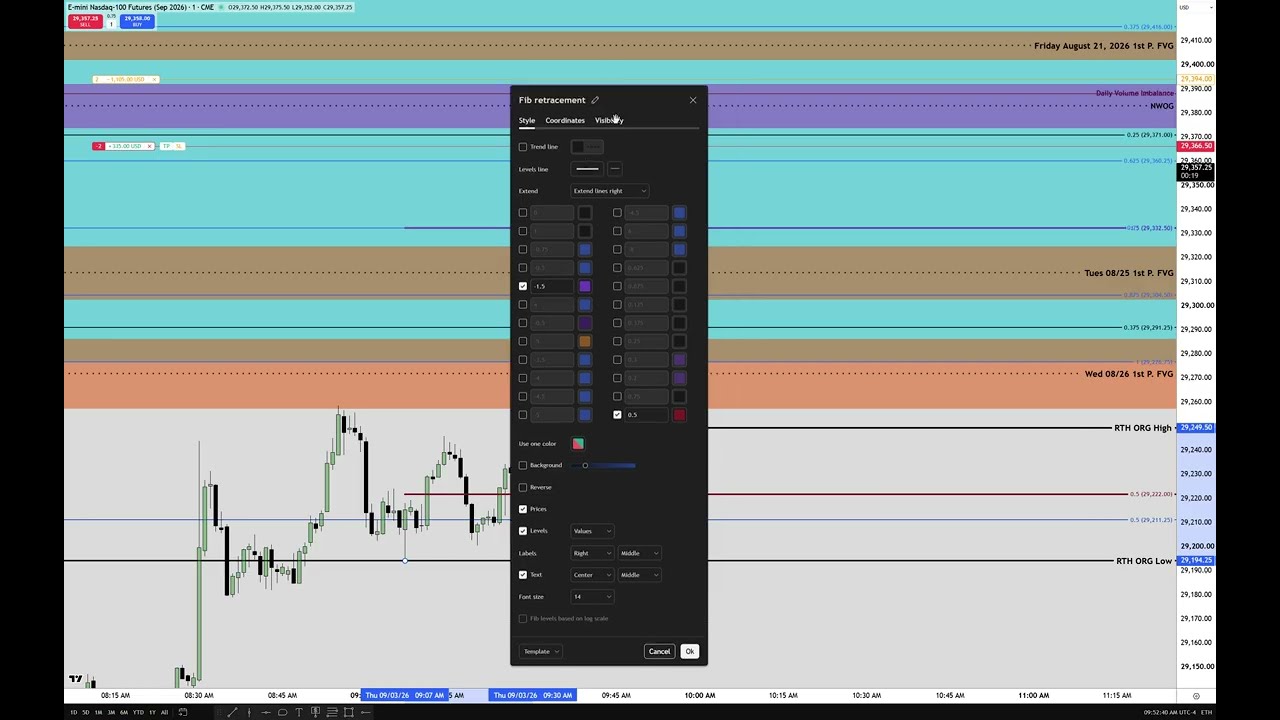
    The speaker is taking a short trade, aiming for the new-week opening-gap low and other prior fair-value-gap targets, because he believes recent 8:30 employment data are manipulated and will push price lower. Entry plan: short near the intraday/high of the gap, place the stop just above that gap high, and validate the trade if price closes below a key inversion fair-value-gap level (29,292.25). He monitors behavior of candles (no bodies in the upper half of inefficiencies) and opening-range gaps to confirm weakness, lowers the stop to ~29,340 once confirmation occurs, and takes partial profits (reducing from three contracts to leave a runner) while managing expectations and risk. He stresses this is guided by a market-maker sell-model (first-stage distribution → second-stage redistribution), not guesswork, and notes he usually avoids trading late in non‑farm‑payroll weeks because of heavy manipulation but made an exception to demonstrate his rules. Overall: a disciplined short with clear stop, staged profit-taking, and reliance on specific price-structure rules.

  • How New Students Should Start Part 3

    How New Students Should Start Part 3

    Summary — key ideas and practical steps

    – Main message: Be a disciplined manager of information. Don’t overload charts with gimmicks (heatmaps, liquidity maps). Use a simple, repeatable regimen to get the high-value reference points that actually drive price moves.

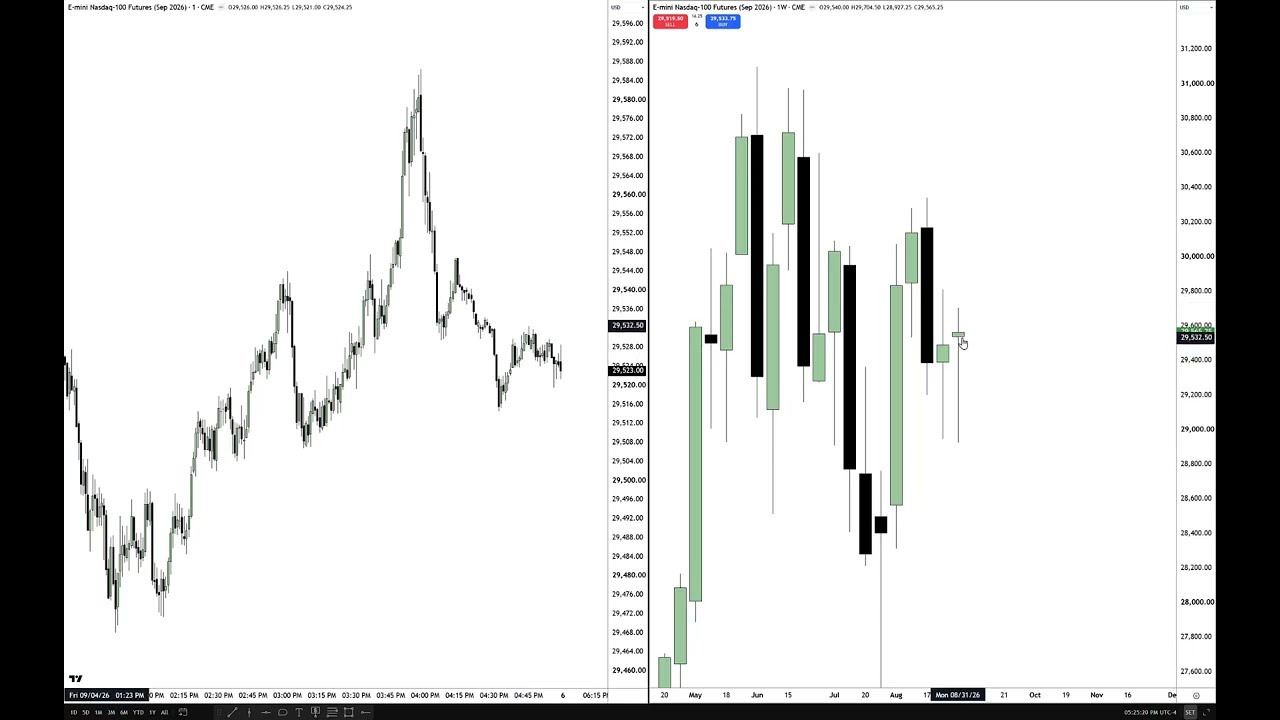
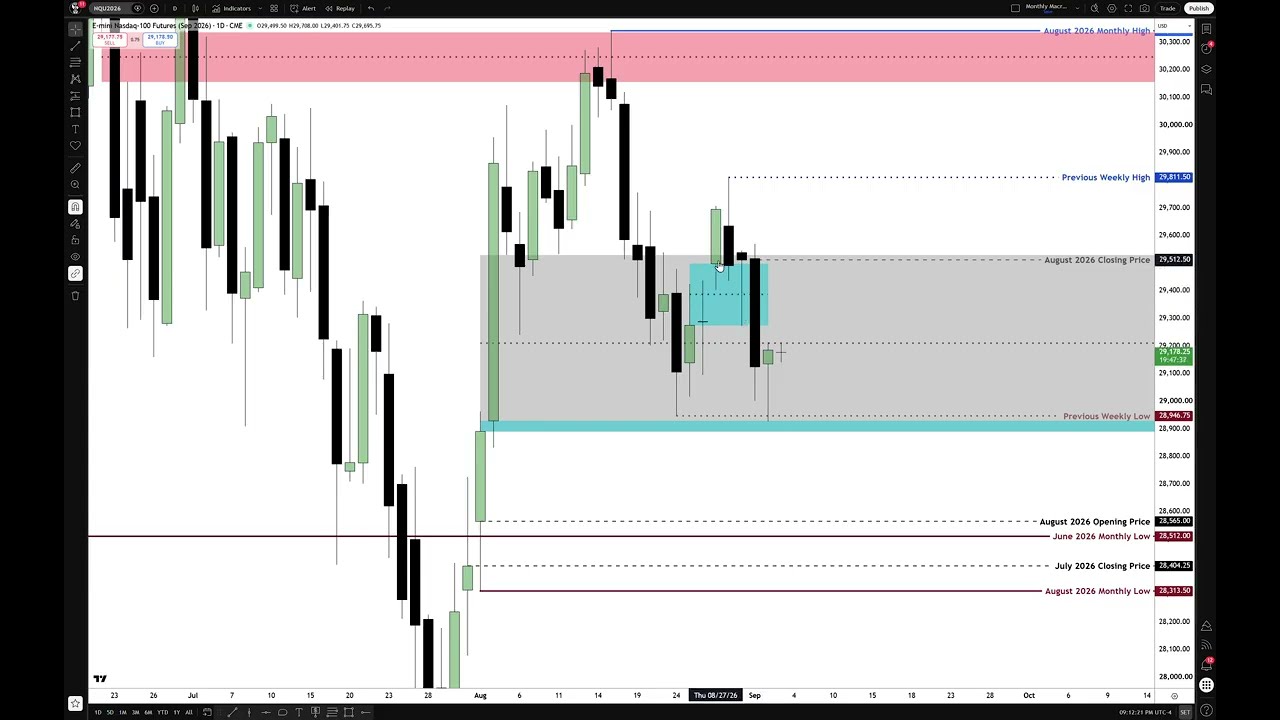
    – Macro first: Build clean higher‑timeframe workspaces. On a monthly chart mark the last three months’ open, high, low, close (HLOC). These give macro premium/discount context and seasonal/quarterly perspective.

    – Weekly and daily follow-up: Add previous week’s high and low, then use the weekly and daily charts to refine where price sits within those ranges (above 50% = premium, below = discount).

    – Create separate layouts (workspaces) for specific purposes so each chart only shows the information you need (monthly macro keys, new‑week opening gap matrix, RTH opening-range gap matrix, first‑presented fair value gaps, etc.).

    – New‑week / new‑day gaps and RTH opening‑range gaps: Track at least the last five weekly opening gaps (Sunday 6:00 pm ET vs Friday close) and maintain matrices for first fair‑value gaps and regular trading hours opening‑range gaps. Grade those ranges and use octants/quadrants to anticipate where price will react.

    – Volume imbalances / fair‑value gaps: Shade inefficiencies (volume imbalance, fair‑value gaps) on higher timeframes and transpose those levels down to lower timeframes (e.g., 1‑minute) to find precise intraday reactions and trade locations.

    – Time matters: Seasonality and event timing matter (example: September often weak; NFP week — new traders should mostly stop trading by ~11:00 am ET Wednesday). Time + price + graded ranges = clarity.

    – Workflow advice: Annotate levels to study and journal, then clear overlays to keep working charts clean. If you can’t follow this simple, structured approach, you’ll struggle — the method requires discipline and consistent data management.

    – Applicability: The framework works for swing, position, intraday, and scalping styles — it’s a coherent system for locating probable price moves rather than guessing with cluttered indicators.

    Bottom line: simplify your charts, collect and manage a few reliable HTF reference points (monthly HLOC, previous weekly H/L, NWG/NOG/RTH gap matrices, graded ranges/volume imbalances), transpose them to lower timeframes, and use time + price context to trade more deliberately.

  • How New Students Should Start Part 2

    How New Students Should Start Part 2

    Summary:

    – Context: Live morning trading session/lecture analyzing a large overnight sell-off and a big regular-hours opening-range gap (9:30 ET). The presenter blends higher-timeframe daily structure (buy/sell-side balance, fair value gaps) with intraday opening-range levels to form a trading plan.

    – Market view and plan: Because of the large opening gap and where daily levels lined up, the bias was to favor longs into the gap rather than shorting. Key target level repeatedly referenced was ~29,212 (a confluence of opening-range fibs and a daily buy-side efficiency). The plan included looking for sweeps of highs to engineer sell-side liquidity, then re-accumulation and runs into buy-side liquidity pools.

    – Trade management and rules emphasized: small, disciplined position sizing; clear entries, stops and partial profit-taking; trailing stops as price proved itself; accept small stop-outs as part of the process; be nimble in consolidation; write trade notes. Concepts used: first-presented fair value gaps, inversion fair value gap, institutional orderflow cues, and the “dead pull” technique to get price moving.

    – Execution highlights: Multiple hypothetical and real trades taken (mainly long), stops adjusted to breakeven/cost-coverage as positions progressed. One losing trade (small stop hit), multiple partials taken. Stop levels mentioned roughly in the 29,100–29,170 area depending on leg. News around 10:00 and the 10:30 one-hour dealing range were noted as important inflection points.

    – Outcome and teaching points: Despite a challenging, choppy morning, the session ended positive — roughly 125–130 handles net (after a small losing trade and several partials). Emphasis throughout was on tape-reading, patience, using higher-timeframe confluence to bias intraday trades, accepting losses, and teaching beginners to record and learn from each trade rather than chase demo perfection.

    – Tone: A conversational, instructional livestream aimed at students—mixing technical analysis with practical tradecraft and real-time decision commentary.

  • How New Students Should Start Part 1

    How New Students Should Start Part 1

    https://www.youtube.com/watch?v=BWEPtHZ1Y2Y

    Summary:

    – Market context: Entering September brings stronger, cleaner price delivery due to seasonal/holiday-driven flows. Check the economic calendar (Forex Factory) and focus on US-dollar/high-impact events — especially ISM, JOLTS, and Non-Farm Payroll (NFP) week.

    – NFP-week guidance: NFP Friday causes big volatility. Treat the week specially: Mondays of NFP-week often present reliable setups; avoid trading on Thursday and Friday (and until 11:00am on Wednesday) if you are a new trader. Learn patience and discipline.

    – Key time windows: The “macro” window is the last 10 minutes of the hour + first 10 minutes of the new hour — high-probability times for directional runs. For RTH (regular trading hours) gaps, half-gap fills happen often (quoted ~70% into 10:00am).

    – Chart preparation and workflow: Do a weekly/monthly prep (best done on weekend). Annotate monthly/weekly highs/lows and make those levels visible across all timeframes. Create and save separate workspaces/layouts (e.g., naked price, opening-range gaps, fair-value gaps) to avoid clutter and speed navigation.

    – Structural levels and annotations: Mark buy-side and sell-side liquidity pools, suspension blocks (buy/sell balance/efficiency areas), fair value gaps (including inversion gaps), wicks as mile-markers, midpoints/octants, and RTH opening-range gap high/low/settlement. Keep labels right-justified for consistency across timeframes.

    – Reading price action: Use higher-timeframe anchors (daily/weekly/monthly) to define probable targets and areas where stops/liquidity sit. Watch how price behaves around these levels (bodies vs. wicks, closes above/below midpoints) to infer continuation or reversal.

    – Execution & risk management: Use partial profit-taking (e.g., take some off at an “event horizon” / midpoint) and trail stops down to protect gains. Don’t be emotionally married to being “right” — follow a repeatable model and accept transactional errors.

    – Practice regimen: Demo/tape-read before trading real money. Record one-minute charts (or your session) and review, screenshot key inflection moments, annotate them, and journal observations. Consistent practice and journaling build the skill to recognize setups.

    – Teaching philosophy: Start simple, build habits, and avoid chasing high-risk funded challenges early. The goal is consistent process and understanding, not heroic single-trade wins.

  • NQ Trade Review Jackson Hole Symposium Day #2

    NQ Trade Review Jackson Hole Symposium Day #2

    https://www.youtube.com/watch?v=iSWZOe3aUFE

    Summary:

    – The speaker reviews NASDAQ price action during day two of the Jackson Hole Symposium, describing significant volatility, “seek-and-destroy” moves (second runs that take out highs/lows), and how they traded using tools like Fibonacci anchors, inversion fair value gaps, inefficiencies, order blocks and discount wicks.
    – They explain trade decisions and executions, note technical issues (market-replay executions hidden while rendering video in Camtasia), and admit imperfect execution and missed exits during the session.
    – Key market takeaway: Jackson Hole week produces large, often manipulated moves—expect volatility and frequent retraces; respect these events and prepare your plan accordingly.
    – Trading advice: novices should avoid trading real money during such weeks (or at all until sufficiently experienced); watch live price action and tape-reading instead of impulsive demo trading; log and annotate price behavior, backtest your observations, then demo-trade for a minimum of 2–3 months before risking live funds.
    – Behavioral guidance: don’t trade to please an audience; avoid overleveraging or chasing gains (especially on Fridays); cultivate discipline and patience by focusing on process and repeating observed patterns rather than money.
    – Next week the speaker will post daily lectures on what to observe in price action to build a repeatable model and prepare students for demo then live trading. They reiterate this is market commentary, not investment advice.

  • NQ Trade Review & Deep Dive Into Price Delivery

    NQ Trade Review & Deep Dive Into Price Delivery

    https://www.youtube.com/watch?v=MD1Ts09dkYs

    Summary:

    – Context: Live trading review from Aug 28, 2026 covering trades taken on day one of the Jackson Hole Symposium and the technical reasoning behind them. Emphasis on using the daily chart to set the framework and drilling into a 1‑minute view for execution.

    – Framework and concepts used: daily PDA (price‑delivery arrays) levels, buy‑side/balance‑sell‑side efficiency (gray shaded area), suspension blocks (cibby), volume‑of‑bounce, fair value gaps (FVG) and inversion FVGs, consequent encroachment (mid‑wick behavior), liquidity pools, order blocks, and the idea of “seek-and-destroy” stop sweeps. He repeatedly stresses reading open/high/low/close (price action) and anchoring levels to leftmost pivots.

    – Trade narrative and execution: he saw a false break below key lows, entered long anticipating a stop‑sweep and reversal into daily buy‑side efficiency, pyramided the position (add at/below equilibrium), took partial profits at pre‑planned targets, and nearly got stopped out by one tick. If stopped, he would have immediately re-entered. He adjusted stops and exits dynamically based on wick behavior, equilibrium, and inefficiencies.

    – Rules and risk management highlighted:
    – Pyramid additions at or below equilibrium (don’t add beyond equilibrium).
    – Add on consequent encroachment/equilibrium; use partials and runners.
    – Place stops with market mechanics in mind (futures have identical prices; forex can have widened spreads).
    – Anticipate price behavior rather than react to it.

    – Teaching points: learn his trading “language” (how he describes wicks, midpoints, gaps), annotate charts, backtest, and slow down when learning. He argues his methods come from decades of experience and are deterministic in reading market structure.

    – Market view & advice: Jackson Hole days are volatile—day one especially prone to engineered liquidity/seek‑and‑destroy—so expect the unexpected. Short‑term bias was bullish into daily buy‑side efficiency with nearer targets noted around the 29,757–29,830 area, but remain cautious and adaptive.

  • NQ Trading Seek & Destroy Profile Jackson Hole Symposium Day 1

    NQ Trading Seek & Destroy Profile Jackson Hole Symposium Day 1

    https://www.youtube.com/watch?v=SUcRywSry5U

    – The speaker is trading NQ during day one of the Jackson Hole Symposium using a “seek and destroy” intraday model that targets the session high.
    – The plan relies on structure like inversion fair value gaps, buy-side imbalances, wicks, order blocks and “PD arrays” to identify entry, stop placement (under the wick), and pyramid opportunities.
    – He waits for price to behave around prior representative fair value gaps and upper-half wick closes, enters longs, moves stops to breakeven/positive when conditions are met, and places limit orders at defined intraday highs.
    – The trade is patience-intensive: price consolidates (“corks”) and slowly probes stops, leaving imbalances partially unfilled — a bullish sign he wants to see before adding size.
    – He narrates emotional management, trade adjustments, and skepticism of other indicator methods, emphasizing experience and discipline.
    – Result: price eventually breaks upward, he takes partial profits at his target, raises stops, documents the trade, and posts proof.