Category: ICT YouTube

  • ICT Chain Of Custody Of Price

    ICT Chain Of Custody Of Price

    https://www.youtube.com/watch?v=dYQSUCSbYn8

    – This lecture reviews the instructor’s price‑action method applied to the Nasdaq September 2026 mini contract, emphasizing clarity on why recent moves happened and how to anticipate them using his proprietary PD (price‑dissection) arrays.

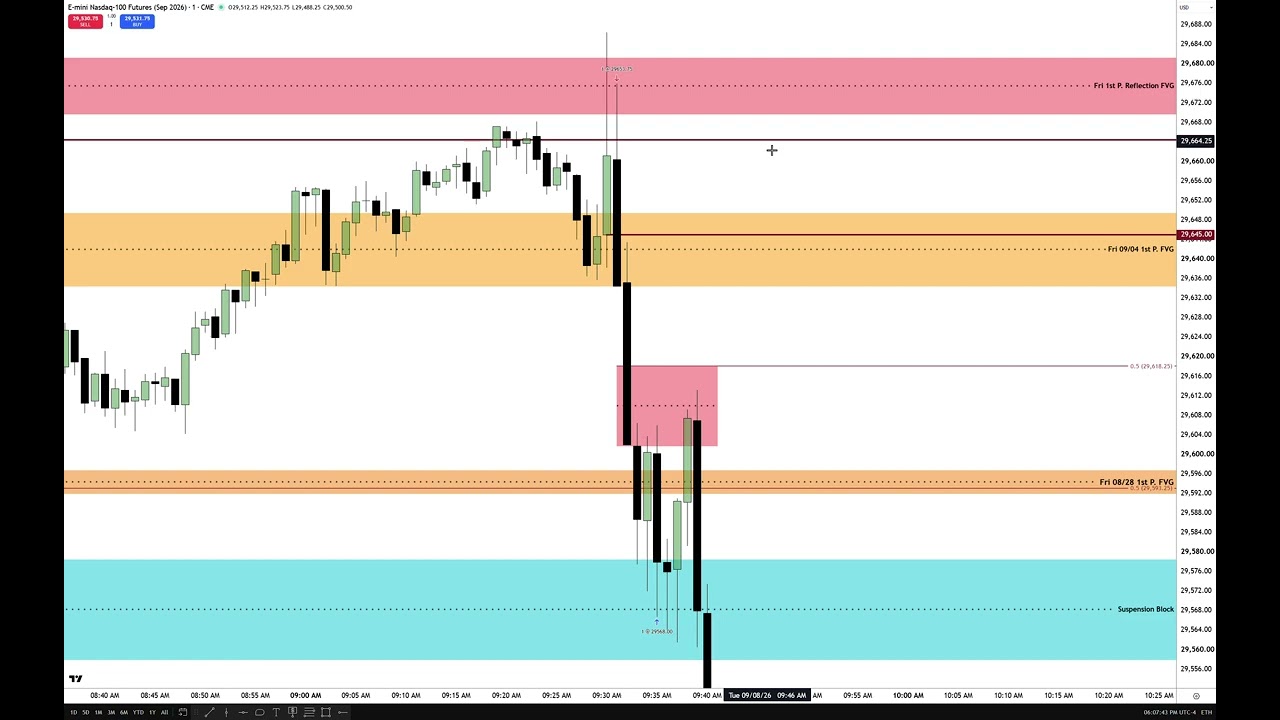
    – Core concepts: grade and track specific PD arrays (sell‑side imbalances / buy‑side inefficiencies a.k.a. SIBIs, fair value gaps, consequent encroachment / midpoints, volume imbalances, suspension blocks). These form a repeatable “chain of custody” that guides where price is likely to go.

    – Practical rules stressed repeatedly: use candle bodies (not wicks) to define ranges; treat upper/lower halves of inefficiencies as premium/discount — bodies in the lower half indicate bearishness (and vice versa); midpoint (consequent encroachment) and half points are key targets and rejection zones.

    – Multi‑timeframe workflow: collect and carry daily PD levels down into lower timeframes (down to 1‑minute) and use opening‑range gaps, extended fair value gaps, and octant/ quadrant grading to locate high‑probability entries, stops, and targets.

    – Week’s example: he annotated how clustered PD arrays and a daily purple volume imbalance acted as liquidity draws; price respected midpoints, formed measuring/inversion fair value gaps at expected places, and delivered the bearish range he anticipated. He showed a live trade, partial miss and later recovery, to illustrate execution and management.

    – Teaching points: this is advanced material that requires backtesting, note‑taking and repetition. Beginners will find it hard initially but will benefit from learning in volatile conditions. He warns against sloppy anchoring to arbitrary highs/lows or trendlines.

    – Differentiator: he claims his rules are unique, teachable, and reproducible if students use his exact PD arrays and grading process rather than generic support/resistance methods.

    – Next steps: he’ll stop giving advance levels next week to force students to practice grading PD arrays themselves; he will provide daily hindsight reviews so students can learn to recognize the patterns and build skill through repetition and backtesting.

  • Nasdaq Futures Trade Review & Commentary – July 22, 2026

    Nasdaq Futures Trade Review & Commentary – July 22, 2026

    https://www.youtube.com/watch?v=2H_qpeIp2rY

    Summary:

    The speaker reviews recent NASDAQ action using their order-flow framework (buy/sell imbalances, fair value gaps, PD arrays). Overnight price hovered above Wednesday’s 1-hour buy-side imbalance, then opened down into Monday’s regular-hours opening-range gap and rallied into yesterday’s fair value gap before 10:00 (a ~100-handle run). During electronic hours the market failed to sustain a bullish first-utilization gap, inverted into a fair value gap, and rolled lower into Tuesday’s first-presented fair value gap—where the speaker entered a short. They rode the decline to Monday’s opening-range consequent-encroachment midpoint, scaled partial profits at predefined levels, saw a retracement, then another sell-off and a later rally into the 60-minute buy-side imbalance/high octant before the close.

    Key themes:
    – Use of first-utilization vs. first-presentation and inversion of fair value gaps to read bias.
    – Failure of a premium PD array to be tradable was taken as a strong bearish signal.
    – Specific execution: short taken into Tuesday’s fair value gap, partials taken at split levels toward Monday’s encroachment midpoint.
    – Commentary on teaching consistency, social-media posting delays, and community skepticism.
    – Plans to update before the next open if possible; signs off with well wishes for trading.

  • Reviewing High Resistance Liquidity Run Conditions – July 21, 2026

    Reviewing High Resistance Liquidity Run Conditions – July 21, 2026

    https://www.youtube.com/watch?v=e6XwTK4hVqI

    Summary:

    – Review of a short-term NASDAQ trading session (1-minute chart) focused on Sept 2026 delivery, with emphasis on a large gap up from prior settlement (~450 handles).
    – Core rule taught to Caleb: use the opening-range gap bias for the first hour—if the gap is sufficiently large (20–40+ handles), bias toward the midpoint/half-gap (short on gap-up, long on gap-down). If the gap is small, don’t trade.
    – Decision framework is simple: pick a bias, wait for price to interact with key hourly reference levels (swing lows, “buy-side efficiency” from the hourly chart) and relative equal highs/lows, then execute with defined stops and partial exits.
    – Trade recap: initiated shorts into resistance, got stopped, re-entered, took partial profits, later stopped out again—overall a difficult, choppy session but managed drawdown by scaling and exits.
    – Observations: price formed an inversion fair-value gap and failed to reach the half-gap; market was indecisive and traded around hourly reference levels without clear follow-through—advice: often best to sit out during such conditions.
    – Near-term view: could revisit today’s opening range gap overnight or continue higher; geopolitical news could change setup, so stay cautious and watch the opening-range and hourly reference levels tomorrow.

  • Trading In High Resistance Liquidity Run Conditions – July 21, 2026

    Trading In High Resistance Liquidity Run Conditions – July 21, 2026

    https://www.youtube.com/watch?v=tp0qkiWCctw

    Summary:

    – Trader livestream reviewing a volatile intraday session. Yesterday’s price hit his pre-market objectives; today opened with a large opening-range gap and quickly became choppy and manipulated.
    – He described his trading plan and actions: sold one contract based on a 60-minute “buy-out-of-balance”/sell-side efficiency, targeted relative equal lows and the half-gap, took partials, got stopped out, re-entered, and ultimately captured some of the move but endured whipsaws.
    – Key technical concepts emphasized: opening-range gap and half-gap as magnets, sell-side efficiency/inversion fair-value gaps, relative equal highs/lows, liquidity pools, and the distinction between bodies (confirm breakdown) vs wicks (failed break).
    – Recurrent market behavior: “high-resistance liquidity run” conditions — lots of price sharing in a tight range, quick runs to obvious stops, repeated retracements and stop-hunting (he personified the mover as “Phil”).
    – Risk and trade management lessons: keep position size small in volatile/high-resistance markets, move stops and take partials to manage psychology, don’t try to force entries when price is highly manipulated, and use morning-session bias (9:30–11:00) and gap structure as a simple framework.
    – Teaching note: these are hard conditions for students/new traders; better to demo/paper trade or sit out until price shows low-resistance (clear, stretched) moves.

  • NQ Futures Trade Review – July 20, 2026

    NQ Futures Trade Review – July 20, 2026

    https://www.youtube.com/watch?v=2L88yH3LKcs

    – Context: intraday walkthrough of NASDAQ using daily → hourly → 1-minute charts, focusing on key levels: consequent encroachment (gap midpoints), relative equal highs/lows, hourly buy-side/sell-side efficiencies, octant levels and order blocks.

    – Market read: the market gapped up at the open and ran sharply higher from 9:30, but several important signs suggested the rally was engineered to capture liquidity rather than a sustained buy: candlestick bodies repeatedly failed to reach key midpoints/upper quadrants (wicks reached but bodies did not).

    – Trading thesis: that failure-of-body signatures and the presence of engineered buy liquidity made a short from the high a high-probability trade. The speaker scaled into short positions as the rally showed distribution, then targeted lower levels (including the regular trading-hours opening-range gap midpoint and relative equal lows).

    – Execution & outcome: sold into the run above the short-term high, scaled entries, one stop was briefly taken above a short-term low, then price dropped into the intended target area. Profit-taking and order placement were adjusted in real time as structure changed.

    – Technique & rules emphasized: anchor Fibonacci/levels precisely to key highs/lows; prioritize OHLC candlestick bodies (not wicks); use order-flow signatures and inefficiencies; avoid alternative bar types that obscure true open/high/low/close.

    – Market philosophy: markets are liquidity-driven and often “rigged” by algorithms and smart money presenting opportunities to harvest stops; publicly posting stops can attract copy-traders and move price to those levels.

    – Teaching/style notes: the presenter alternates personas (an “ICT” teaching style vs a calmer approach) as a pedagogical/engagement tool and stresses psychological and practical aspects of learning to read order flow rather than blindly copying entries.

  • Futures General Commentary – July 20, 2026

    Futures General Commentary – July 20, 2026

    https://www.youtube.com/watch?v=xbtW_0ipuos

    – Market outlook: this week’s economic calendar is light, so expect low news-driven volatility. The speaker has no strong directional bias and is watching the opening range; they’ll wait until about 10:00 to see a clearer signal (look for liquidity clears back toward Friday’s settlement).

    – Short-term price action: current trade is near last week’s TGIF range with a premium opening. Preferred scenario is a pullback to clear sell-side liquidity, retest/overshoot of Friday’s settlement, then rejection and a bullish fair-gap/inversion to drive a meaningful rally.

    – Trading approach: favor a market‑maker/smart‑money accumulation model — low‑risk buys near liquidity pools and reclaimed bullish fair value, but remain flexible if structure fails.

    – Crude oil: technicals show bullish structure (breaker/inefficiency and supportive volume balance). Seasonally, energy often rises from early July into October as large buyers restock, so price is biased higher absent contrary events. Geopolitical escalation (e.g., major strikes in the region/straits disruptions) could send oil much higher and fuel a strong, volatile bull market. Options are expensive; position size caution advised.

    – Gold: some recent sell-side pressure and targets hit; take-profits recommended and watch for possible pullback before larger bullish setups.

    – Silver: underperformed slightly, almost reached targets but left an inefficiency; monitor for follow-through.

    – Bitcoin: speaker notes prevailing online FUD and debates; acknowledges long‑term support but tones down certainty.

    – Miscellaneous: minor TradingView annotation glitch mentioned; next instrument to check is copper.

    Overall: light news week — watch opening-range/10:00 action, prefer accumulation on liquidity clears, bullish bias in crude (seasonal + geopolitical risk) while managing risk given elevated volatility.

  • NQ Futures Weekly Range Market Wizardry

    NQ Futures Weekly Range Market Wizardry

    https://www.youtube.com/watch?v=NPU4gsM9jqA

    Summary:

    – The speaker defends long-form trading education over short-form clips, saying brief videos can’t teach the depth and context his lessons provide. He makes students “work for it” and posts free, detailed lectures across platforms (YouTube, X, ICT spaces).

    – Core teaching: use higher-timeframe structure (daily chart) to forecast the weekly range and key price targets before intraday action unfolds. He emphasizes suspension blocks, volume imbalances, fair value gaps/inefficiencies, and relative equal highs/lows as the primary draws for price.

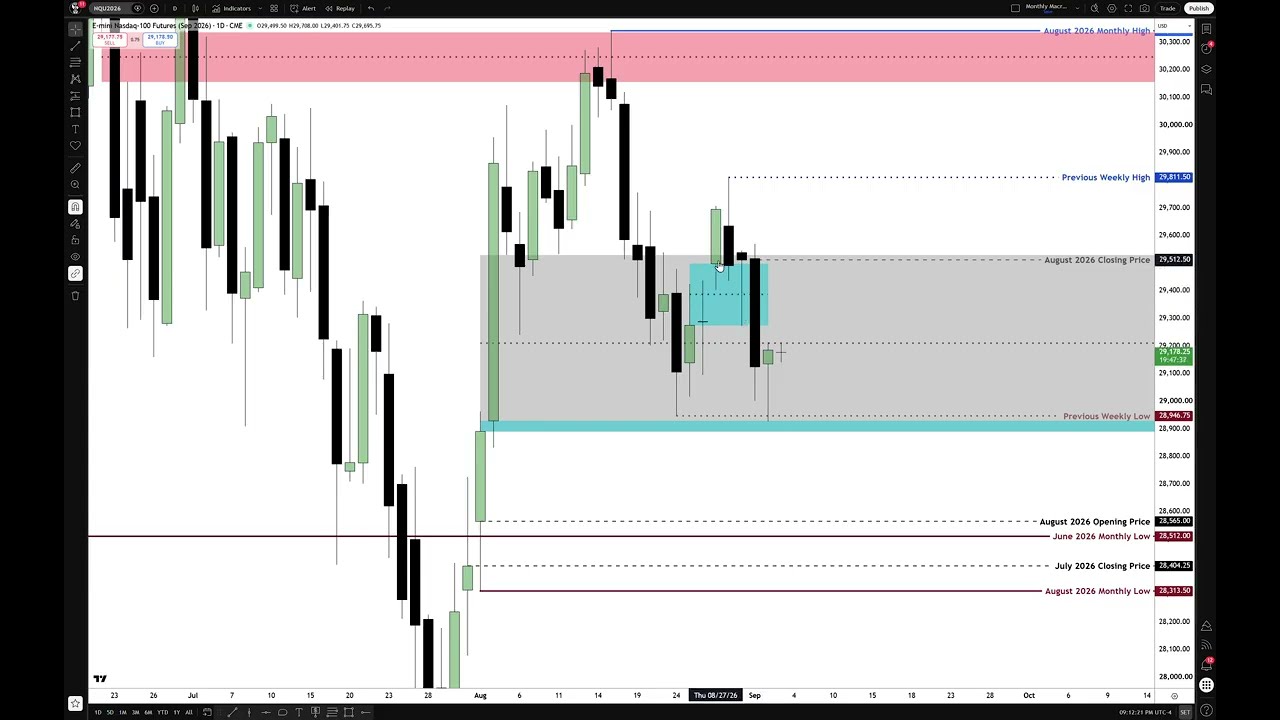
    – For the week in question he predicted in advance a “new week opening gap” in a premium area that would limit upside and act as the weekly draw to lower prices—specifically the daily relative equal low at ~28,512. He documented this view daily and used it to guide intraday reads.

    – Market rhythm: Monday–Wednesday were harder (news like CPI/PPI), while after Wednesday PM the market became low‑resistance and produced easy directional runs (Thursday/Friday). Session opens (especially 7:00am pre‑market and 9:30am regular open) provide the volatility/“rocket fuel” that executes the weekly draws and liquidity hunts.

    – Intraday mechanics shown: short-term buy/sell-side efficiencies, market-maker sell model, and liquidity pools. Electronic trading hours often fill gaps and give early clues before regular trading hours; studying how gaps and overnight prints behave is important.

    – TGIF concept: after a weekly low and retrace, the close often retraces to ~20–30% of the weekly range. He used that to forecast the weekly close successfully.

    – Main lessons for students: study full lectures, follow the multi-timeframe structure and price signatures, prioritize time and position of sessions, and focus on mapping the weekly targets rather than relying on short clips or simplistic support/resistance ideas.

    – Final point: his method is about predicting and proving price behavior before it happens; students should put in the time to learn the process rather than dismiss it based on short excerpts.

  • Midnight ET Principles In Relationship To PreMArket Session

    Midnight ET Principles In Relationship To PreMArket Session

    https://www.youtube.com/watch?v=KHkUPAsdyfk

    The speaker reviews a recent Nasdaq trading session and reiterates a teaching focus on the “midnight” New York open and pre-market structure (pre-market watching often 6:30–7:00 AM, official pre-market 7:00–9:00 AM). He explains the midnight open often acts as a fulcrum for the day’s range and describes an ICT “power three” pattern (brief lift above the open, then a drop). Using daily and intraday examples, he shows how a drawn liquidity objective at the daily relative equal low led to a predictable move down into that zone, followed by massive short-covering that pushed price back up into relative equal highs but typically not all the way to the midnight open. Key trading lessons: target the relative equal highs for partial profit rather than expecting a full retrace to the open; fair value gaps/order blocks can trigger without a candle close through them; narrative and context matter more than rigid rules. He emphasizes he focused students on Nasdaq all week to demonstrate these tools and promises a market recap after close.

  • Trade Explanation AM Session & Hangman PD Array 07\16\2026

    Trade Explanation AM Session & Hangman PD Array 07\16\2026

    https://www.youtube.com/watch?v=Dj0663u7VRc

    Summary:

    – Market view: The presenter expected and saw lower prices after a daily close below a key volume/inefficiency area (sell-side liquidity with relatively equal lows). That setup increased the probability of downside continuation and possible gap lower by Sunday if momentum picks up.

    – Key technical concepts used: daily/weekly anchoring, suspension blocks, buy-side imbalances / sell-side inefficiencies (fair value gaps), quadrants/octants, “consequent encroachment” (midpoint) and “first utilization/first presented” — all used to judge whether a zone will act as premium (resistance) or inversion (support).

    – Intraday action: On the hourly and 1-minute charts, price interacted with a daily suspension block and a 1-hour buy-side imbalance formed Wednesday. Price hit the lower quadrant of the daily inefficiency at the 9:30 open, then rejected and moved lower into the annotated fair-value gaps — validating the bearish thesis. Lunch macro (around 11:30 / 10:00 low) and subsequent price structure reinforced the down move.

    – Trade execution notes: The speaker described missed ideal entries (wasn’t always in front of the chart), pyramiding short entries at inefficiencies, taking partial profits and being stopped out on remaining contracts. He emphasized bodies (open/close) over wicks for true order-flow information.

    – Market psychology and live streams: Retail chat often cheerleads the wrong direction; the public is usually wrong (contra-indicator). Advice: live streamers should largely ignore chat; viewers should not follow chat-driven crowd trades.

    – Teaching/philosophy: High-probability setups are those anchored to daily/weekly timeframes. The instructor keeps certain personal notes/private levels to avoid students overfitting to his precise entries — encourages students to develop their own models through study and repetition.

    – Practical takeaways: Watch for closes below key levels to validate bearish first-utilization, prioritize anchored higher-timeframe levels, use inefficiencies and fair-value gaps to time entries, prefer bodies (open/close) as volume/algorithms’ signals, and cultivate independent trading judgment.

    – Closing: The week’s technical calls mostly played out as taught; consistent study of the method and exposure to the live lessons will speed learning.

  • Post PPI NQ Futures Commentary \ Weekly Analysis Delivered – 07/15/2026

    Post PPI NQ Futures Commentary \ Weekly Analysis Delivered – 07/15/2026

    https://www.youtube.com/watch?v=LBrsLPKXZ2E

    Summary:

    – The speaker reviewed his pre-market tape-reading plan for NQ around the 8:30 PPI release: either price would drop then rally into the new-week opening gap, or rally into the gap then drop. He favored the scenario that would revisit the lower area because the rally was supported by very thin buying (a “toothpick”).
    – Key trading concepts emphasized: order-flow/liquidity dynamics (staging, Judas swings, buy-stop absorption by smart money), using price structure (open/high/low/close and time) rather than fancy indicators, and building short positions in the lower quadrant/upper octant while avoiding the gap’s halfway point.
    – He walked through his live execution: pyramiding into shorts, taking partials to manage risk/psychology, a missed stop execution due to spread/liquidity, and exits around predefined levels. The price later moved into the expected sell-side liquidity and daily volume imbalance areas, validating the plan.
    – Major behavioral and practical lessons: you can’t know outcomes for sure—use stop losses, don’t overleverage, demo trade and log trades, and develop patience, discipline, and responsibility. Trading is a craft that takes years; his method is simple but requires experience.
    – He’s done trading for the week, will focus on teaching, and encouraged students to re-watch prior lectures to see the levels and logic in context.