
Summary — key ideas and practical steps
– Main message: Be a disciplined manager of information. Don’t overload charts with gimmicks (heatmaps, liquidity maps). Use a simple, repeatable regimen to get the high-value reference points that actually drive price moves.
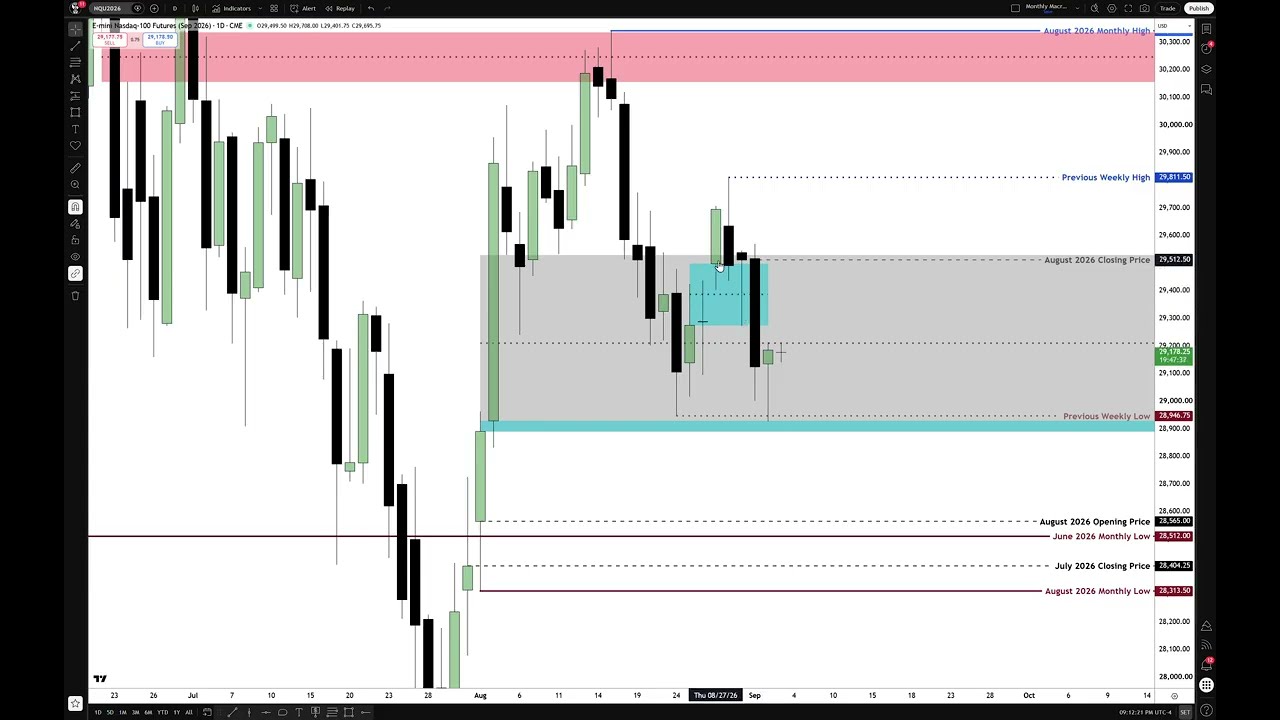
– Macro first: Build clean higher‑timeframe workspaces. On a monthly chart mark the last three months’ open, high, low, close (HLOC). These give macro premium/discount context and seasonal/quarterly perspective.
– Weekly and daily follow-up: Add previous week’s high and low, then use the weekly and daily charts to refine where price sits within those ranges (above 50% = premium, below = discount).
– Create separate layouts (workspaces) for specific purposes so each chart only shows the information you need (monthly macro keys, new‑week opening gap matrix, RTH opening-range gap matrix, first‑presented fair value gaps, etc.).
– New‑week / new‑day gaps and RTH opening‑range gaps: Track at least the last five weekly opening gaps (Sunday 6:00 pm ET vs Friday close) and maintain matrices for first fair‑value gaps and regular trading hours opening‑range gaps. Grade those ranges and use octants/quadrants to anticipate where price will react.
– Volume imbalances / fair‑value gaps: Shade inefficiencies (volume imbalance, fair‑value gaps) on higher timeframes and transpose those levels down to lower timeframes (e.g., 1‑minute) to find precise intraday reactions and trade locations.
– Time matters: Seasonality and event timing matter (example: September often weak; NFP week — new traders should mostly stop trading by ~11:00 am ET Wednesday). Time + price + graded ranges = clarity.
– Workflow advice: Annotate levels to study and journal, then clear overlays to keep working charts clean. If you can’t follow this simple, structured approach, you’ll struggle — the method requires discipline and consistent data management.
– Applicability: The framework works for swing, position, intraday, and scalping styles — it’s a coherent system for locating probable price moves rather than guessing with cluttered indicators.
Bottom line: simplify your charts, collect and manage a few reliable HTF reference points (monthly HLOC, previous weekly H/L, NWG/NOG/RTH gap matrices, graded ranges/volume imbalances), transpose them to lower timeframes, and use time + price context to trade more deliberately.
Leave a Reply