
https://www.youtube.com/watch?v=EC0UuarROyo
Summary:
– Core idea: Trade one premium PD array (PDA) at a time and use a clear visual candlestick language to read institutional order flow. Bodies in the lower half of a PDA indicate bearish order flow; bodies in the upper half indicate bullishness. This simplifies decision-making and forces you to follow the market rather than wishful thinking.
– Daily-first hierarchy: Start with the daily chart (identify PDAs, wicks, inefficiencies, gaps and new-week opening gap) and only then move into intraday timeframes. Valid intraday trades must be supported by the higher-timeframe structure.
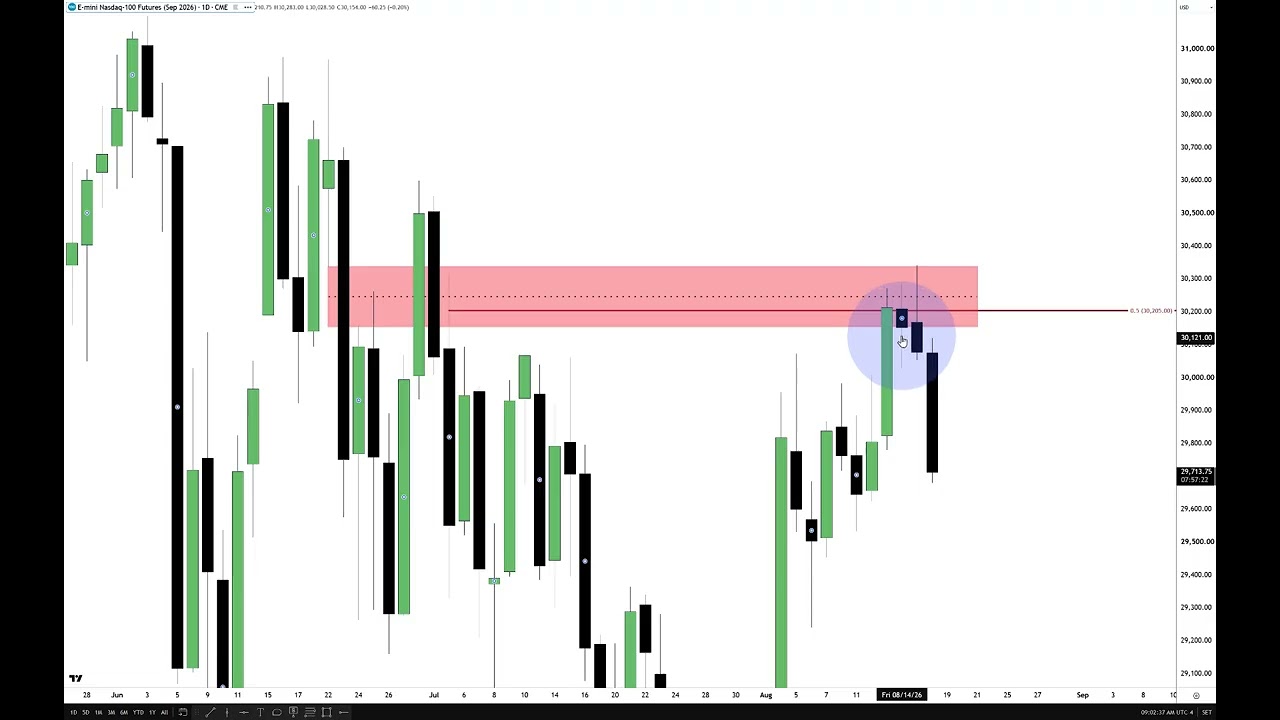
– Obsidian model: Defined as two opposing wicks (the second wick higher than the first). Split each wick in half and use the midpoint/consequent-encroachment levels to grade price action and find trade entries, liquidity pools, and failures. Obsidian helped signal bearish failure in the recent session.
– Practical application: He used the 7:00–9:00am pre-market dealing range, the 9:30 open structure (including a Judas swing), daily wicks/inefficiencies, and specific levels (example target ~30,137.5) to justify shorting into an upper liquidity pool, building position, and scaling out as price hit partial targets. Closing below key PDA levels was an early bearish sign.
– Takeaways: Use consistent rules, carry higher-timeframe levels forward, grade ranges and wicks visually, and avoid relying solely on short timeframes or generic supply-and-demand rules. The method is proprietary to his teaching and informed by his personal process.
Leave a Reply