
https://www.youtube.com/watch?v=o8NfSK-pUlE
Summary:
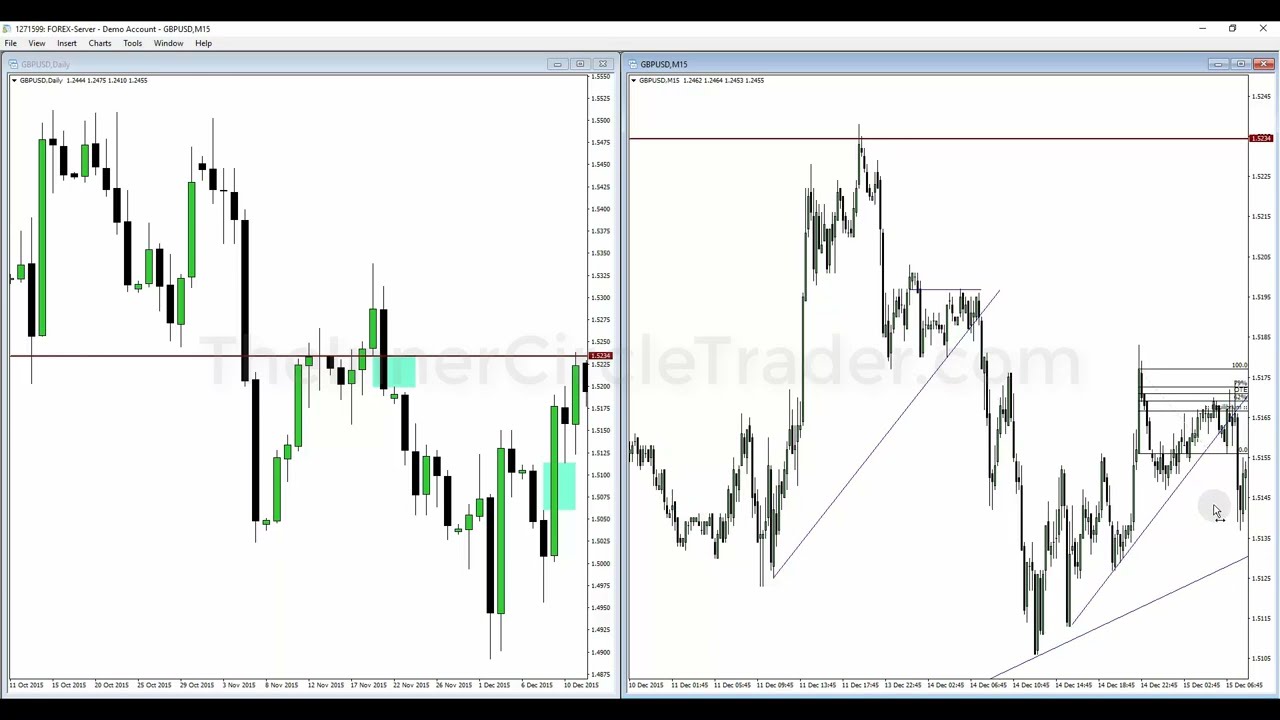
– Topic: “Trendline phantoms” — diagonal trendline support/resistance as a common retail trading idea.
– Claim: Diagonal trendline theory is subjective and offers no reliable statistical edge. Price does not “respect” lines drawn by traders; it moves where liquidity and institutional order flow are.
– Mechanism: Retail traders adopt visible trendlines (higher highs/lows or lower highs/lows), creating predictable pools of stops and orders. Market makers and large funds exploit that liquidity, setting traps that cause retail buyers/sellers to be run over.
– Practical implication: What looks like valid trendline support/resistance often becomes a false signal. Typical patterns:
– Bullish trendline support can lure buyers who are then stopped out when price collapses to institutional levels.
– Bearish trendline resistance can lure sellers who are subsequently short-squeezed upward.
– The high/low between the 2nd and 3rd touches is often the area where smart money acts.
– Trading approach recommended: Ignore diagonal trendlines as primary signals. Instead use higher-timeframe institutional reference points, order blocks, liquidity voids, equilibrium zones, and contrarian entries (breaker, turtle soup, order-block trades) to align with smart-money flow.
– Conclusion: Trendlines are largely “phantoms” for retail. Study lower-timeframe action and institutional context to find where liquidity and smart money will actually move price, and trade against obvious retail trendline setups.
Leave a Reply