
https://www.youtube.com/watch?v=zq4hz_XiTRE
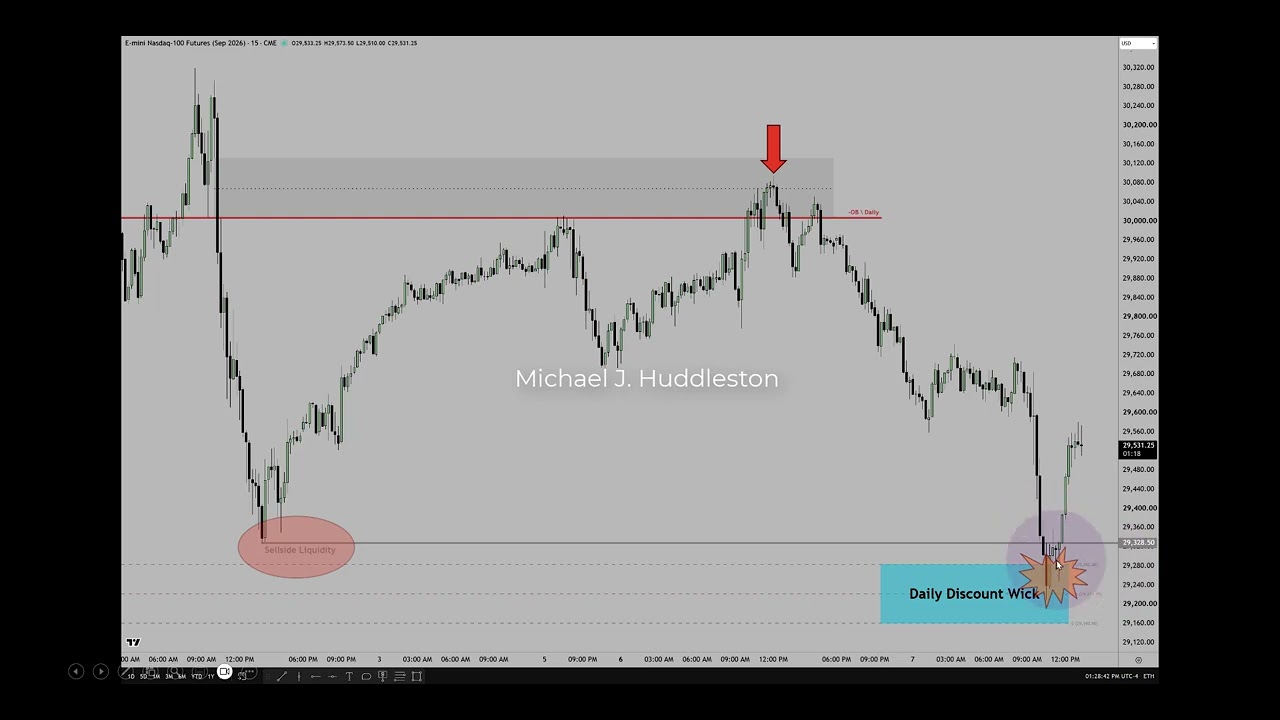
– The presenter reviews recent Nasdaq action using a daily chart plus a focused 15-minute view. He highlights two daily reference points: the “discount wick” (low) and the “up‑close” candle/open (order block/change-of-state), with a key consequent‑encroachment level around 29,221.75.
– The 15‑minute timeframe is treated as a bellwether for intraday/scalp setups and to sync with higher‑timeframe moves. He maps how price respected those daily boundaries, traded down into the discount wick, swept sell‑side liquidity (including last Thursday’s low), then quickly returned into the prior range.
– Technical concepts used: order blocks (his own definition), fair value gaps and inverted FVGs, SIBI/inefficiencies, relative equal highs/lows, lunch‑macro and opening‑range algos, liquidity pools and buy/sell‑side sweeps. He stresses blending timeframes to frame higher‑probability entries.
– He emphasizes process over indicators: use plain open/high/low/close candles, avoid gimmicky candlestick or volume overlays, and measure price structure and body/wick behavior rather than “form‑fitting” after the fact.
– Risk and trade approach: prefers a “one‑shot, one‑kill” short‑term model (few high‑confidence runs per week), warns against forcing trades, overtrading, and holding into weekend gap risk. Notes current volatility is extreme and position sizing/stop discipline is critical.
– Administrative: he corrected a drawing error in his slides, reiterates that his pre‑market commentary predicted the move, and announces upcoming lessons on building a trading path (without using simulated prop firms) over the next few days.
Leave a Reply