
https://www.youtube.com/watch?v=L81eMQhmXmc
This video gives a simple, practical six‑week routine for new students to build pattern recognition in price action by daily logging three repeatable phenomena. Key points:
Purpose and approach
– Don’t try to learn everything at once. Focus on a few repeatable tasks, build habit and sample size, then backtest later.
– Spend ~20 minutes/day, take screenshots and annotate neatly. Keep electronic notes if possible. Study past ~6 weeks and continue forward to build a 12‑week sample (start with NASDAQ if unsure).
Three daily pillars (use 1‑minute charts)
1) Pre‑market phase (7:00–9:00 AM ET)
– Draw vertical lines at 7:00 and 9:00, record the highest high, lowest low, and any relative equal highs/lows.
– Note whether price is trending or consolidating in that window; this often foreshadows behavior after the 9:30 RTH open.
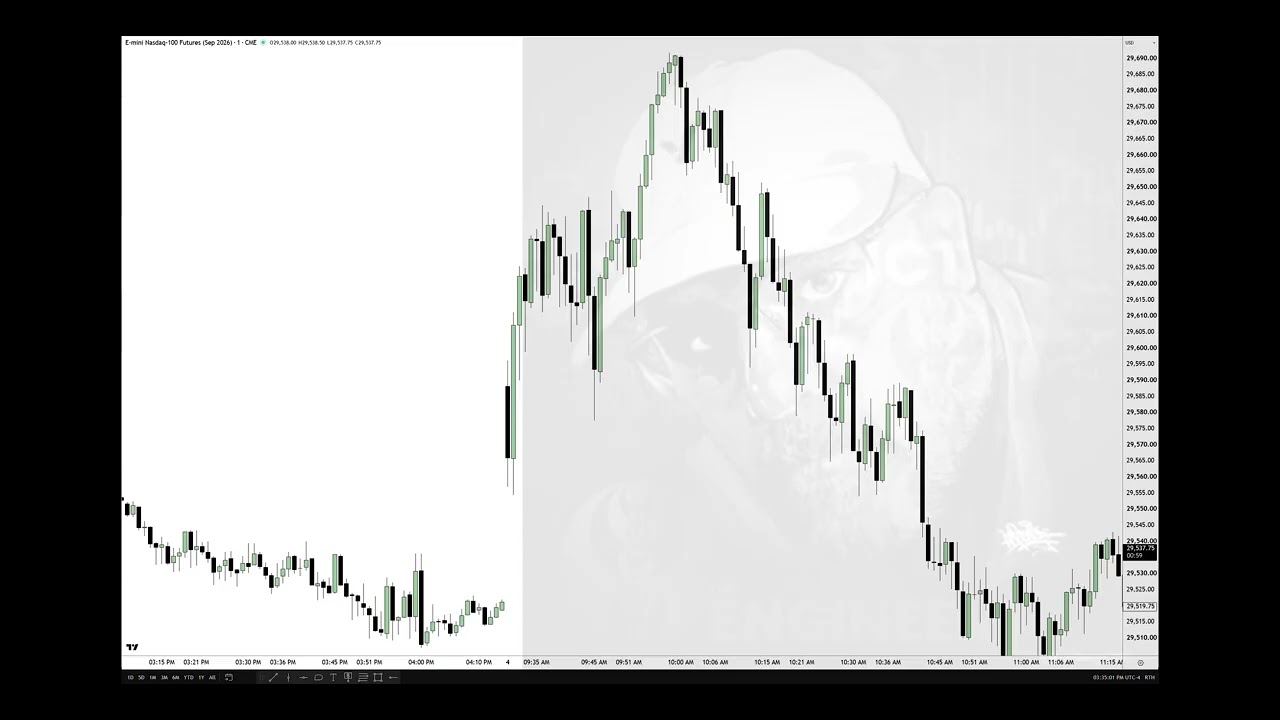
2) Regular Trading Hours (RTH) opening‑range gap
– Toggle RTH on the chart, draw a rectangle from prior close (4:14 PM ET) to the new open (9:30 AM).
– Use the rectangle’s midpoint (inefficiency) and log if/when price encroaches it (often by ~10:00 AM). Track how often and how price reacts.
3) First fair value gap after 10:00 AM ET
– On the 1‑minute chart, identify the first fair value gap that forms at/after 10:00 AM, extend and log when price returns to it and the subsequent move.
– Record times, ranges (handles), and outcomes.
Execution and mindset
– Start with one pillar for two weeks, add a second for weeks 3–4, then the third for weeks 5–6. Consistent daily logging builds recognition, discipline, and confidence—avoid system‑hopping. Review screenshots on non‑trading days to catch missed details.
Leave a Reply