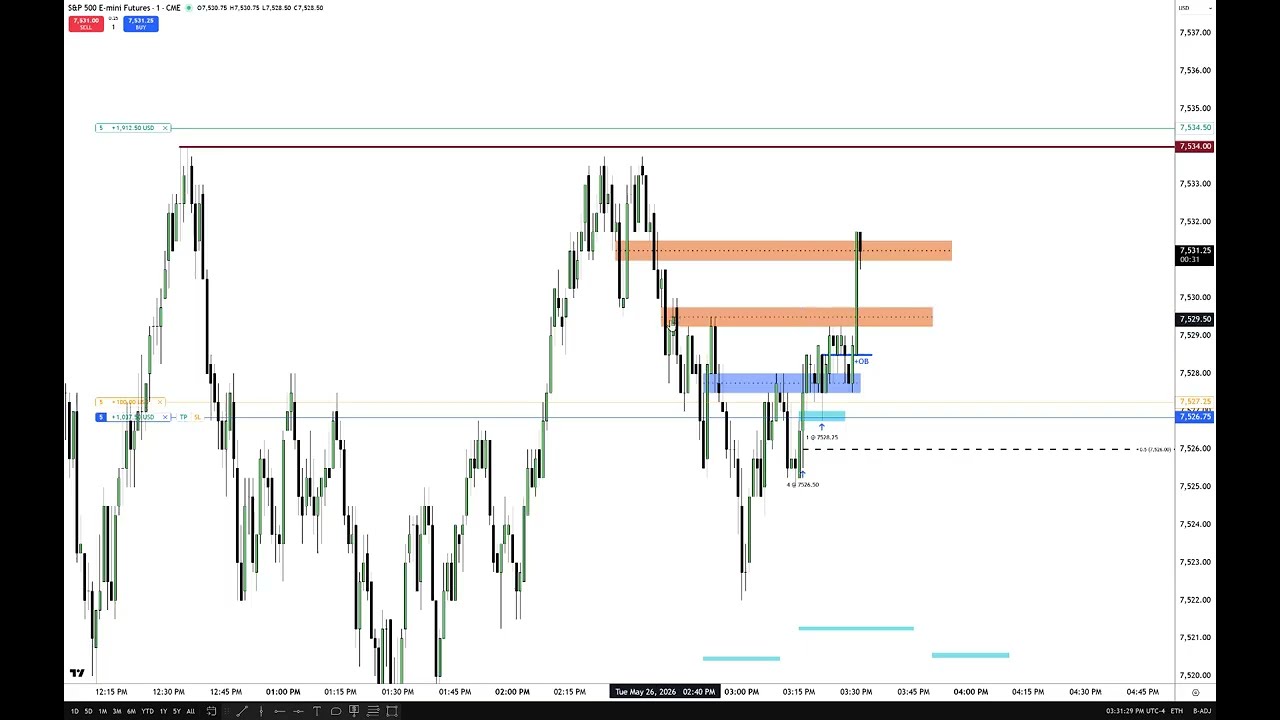
Michael describes taking a long trade with a stop loss just below a recent low, targeting the last hour’s relative equal highs (around 3,400–3,450). They watch for accumulation, footholds, fair value gap inversions and order-blocks as entry/validation points, then raise stops to reduce risk as price confirms. The session is slow and “spotty” early, but a run of big green candles and algorithmic buying in the 3:15–3:45 macro window drives a clean rip higher. The trader criticizes sloppy use of “macro” by others, notes this was tradable though not ideal, and ultimately clears positions after the highs are taken out.
– Context and protocol: Today is an FOMC day — trade by 10:30 ET (first hour) and then step to the sidelines until the Fed’s statement and press conference. Be neutral/no bias heading into the announcement; expect choppy, manipulated, or lethargic price action.
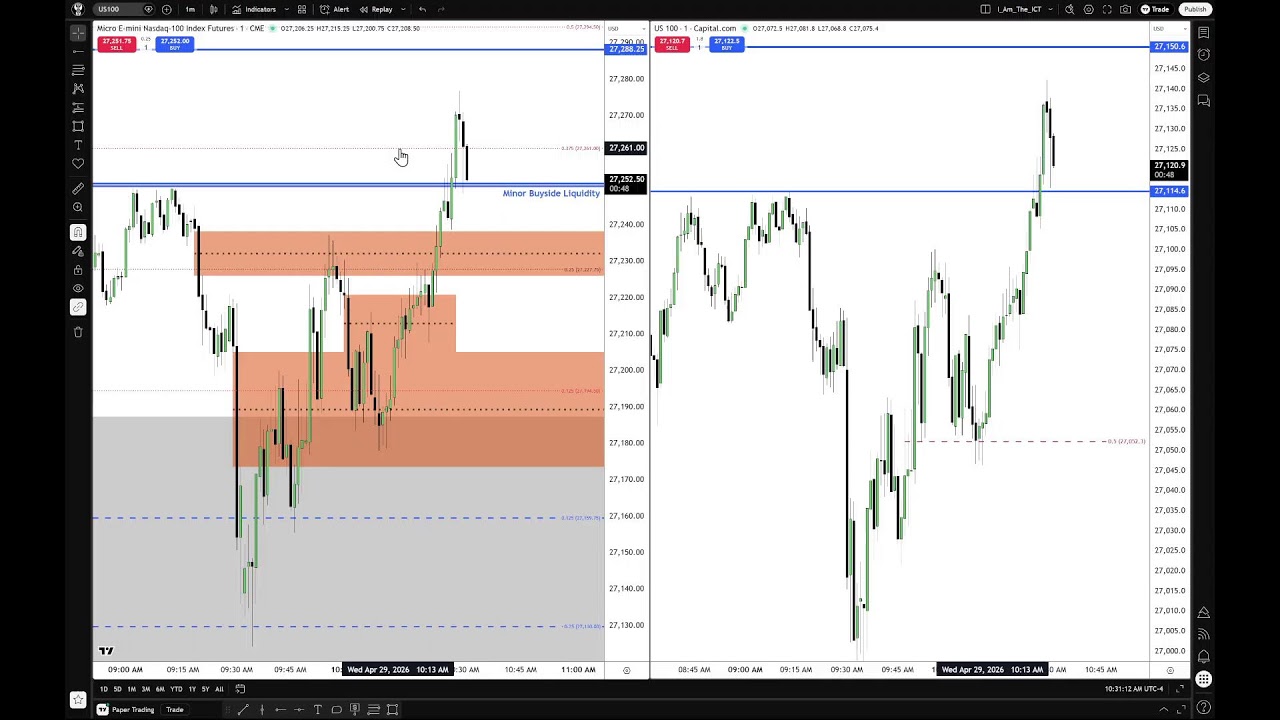
– CFD vs futures / legality: The presenter uses CFD feeds (US100, US500) for demos but paper-trades them because U.S. citizens can’t legally trade some CFD brokers. Price/time alignment between CFD candles and futures is the key when transposing levels. He does not endorse brokers or affiliate deals.
– Recap of yesterday’s execution: He demonstrated a short on MNQ based on a large opening-range gap down, targeting lower-quadrant/octant levels and portions of last week’s range (30% → 20%). Trade rationale relied on market-maker sell-model signatures: opening-range gap, inversion/fair-value gaps, consequent encroachment, and relative equal lows.
– Technical framework emphasized: opening-range gaps (RTH), octants/quadrants, inversion/fair-value gaps, order blocks, buy/sell-side inefficiencies, and relative equal highs/lows as liquidity targets. He uses time-aligned candles to map levels between feeds.
– Practical live observations: This morning’s action was slow and balanced with minor buy- and sell-side inefficiencies. He described what would confirm a bullish run (body above specific midlines) versus signs that a lower sweep was likely (bodies staying in lower halves, closing below key lows).
– Execution mechanics note: He avoids market-replay for live execution demonstrations because replay changes on-screen execution markers; highlighted that small differences in candle formation/timing matter when mapping levels.
– Trading mindset and pedagogy: Tape-reading is a discipline—make it routine, calm, and process-oriented (meditative rather than adrenaline-driven). Trust a repeatable model, accept uncertainty, practice indifference to outcomes, keep a journal, and focus on risk management and execution rather than chasing profits or emotional wins.
– Final practical advice: On FOMC days, limit live trades, observe and learn, and only engage when your model gives clear, high-probability setups. Experience and repetition build pattern recognition and emotional control; maturity is accepting that not every session will produce a perfect outcome.
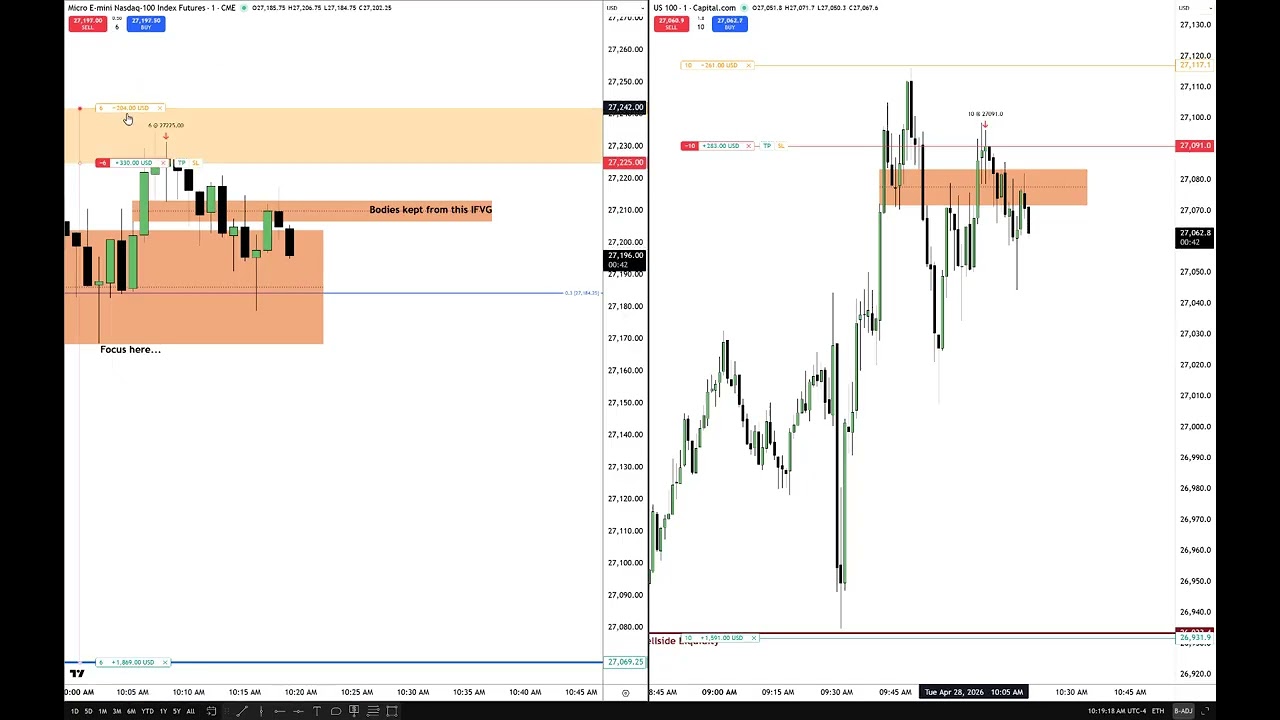
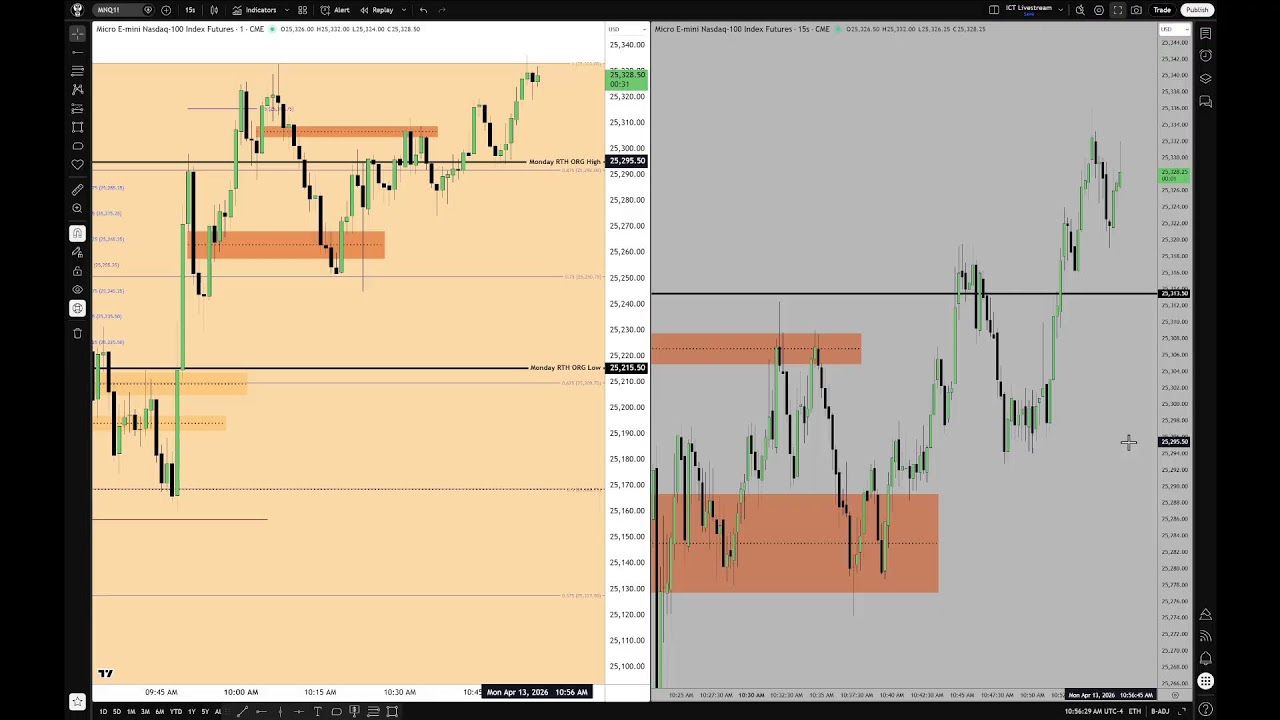
– ICT is executing a short trade in the micro NASDAQ (MNQ) and mirroring it on a US 100 CFD, adjusting stops and targets to the relative equal lows from that morning. – He highlights price discrepancies between real-time MNQ futures and the CFD feed but emphasizes that the same liquidity-based entry logic (lower quadrant 75, opening-range/gap levels, order blocks) can be transposed between futures and CFDs. – Key technical concepts used: opening-range gap, inversion/fair-value gaps, bullish/bearish order blocks, “gray pool” (sell-side liquidity pool between two wicks), event horizon (midpoint between lows), and body/wick placement as confirmation. – Trade management: stop placed above recent highs, partial profit-taking planned at an “event horizon” level, and a time stop rule if price fails to show directional conviction within a few candles. – He annotates the CFD chart heavily for students who can’t access futures markets, demonstrating that CFD price action can validly reflect the same order-flow signals (while noting legal/regional restrictions on CFD trading). – Emphasizes not endorsing any broker shown (Capital.com appears on his chart but he has no affiliate relationship). – The trade is executed and managed live (demo for CFDs due to US legal limits), partials are taken, and execution confirmations appear in the corner—used to teach that the method works across instruments when managed properly. – Overall point: the order-flow/liquidity approach and execution rules used for MNQ futures can be applied to CFDs; careful stop management, candle-body rules, and liquidity targets drive entries, confirmations, and exits.
Quiz
1) What instrument did ICT say he was shorting at the start of the session?
A. S&P 500 futures
B. Micro NASDAQ (MNQ)
C. US 100 CFD only
D. EUR/USD
2) Why did ICT compare MNQ futures price versus the CFD price?
A. To promote Capital.com as a broker
B. To show CFDs are illegal everywhere
C. To compare and contrast real-time price action and show they may differ but map similarly
D. To prove market replay is necessary
3) Which specific entry mechanism level did ICT mention using?
A. Upper quadrant 50 level
B. Lower quadrant 75 level
C. VWAP pivot level
D. Opening range high
4) What name did ICT give to the two-wick liquidity area he annotated?
A. Event horizon
B. Minor sellside pool
C. ICT gray pool
D. Inversion fair value gap
5) What trade management action did ICT describe after the move progressed?
A. Closed the entire position immediately
B. Doubled the position size
C. Took partial profits (e.g., “take three off”, “take two off”)
D. Moved stop to break-even and added a new leg
Answer key with evidence (no timestamps available):
1) B. Micro NASDAQ (MNQ)
Evidence: “All right. So, we’re going to be doing some work here in the CFD. So, I’m going short here in the micro NASDAQ.” and later references to “MNQ” throughout.
2) C. To compare and contrast real-time price action and show they may differ but map similarly
Evidence: “Notice that the prices do not agree, but we’re comparing and contrasting real-time price action with MNQ futures price versus the CFD um price…” and “I’m comparing and contrasting what I would do if I was doing the futures contract only versus what I see in the CFD market.”
3) B. Lower quadrant 75 level
Evidence: “the entry mechanism which is the lower quadrant 75 level”
4) C. ICT gray pool
Evidence: “There’s a gray pool forming. … Now, in between those two consequent encroachments, that is the ICT gray pool.”
5) C. Took partial profits (e.g., “take three off”, “take two off”)
Evidence: “Take three off. That’s good. … And we’ll take two off here in the MNQ and we’ll market that.” and “I’m probably going to take something off.”
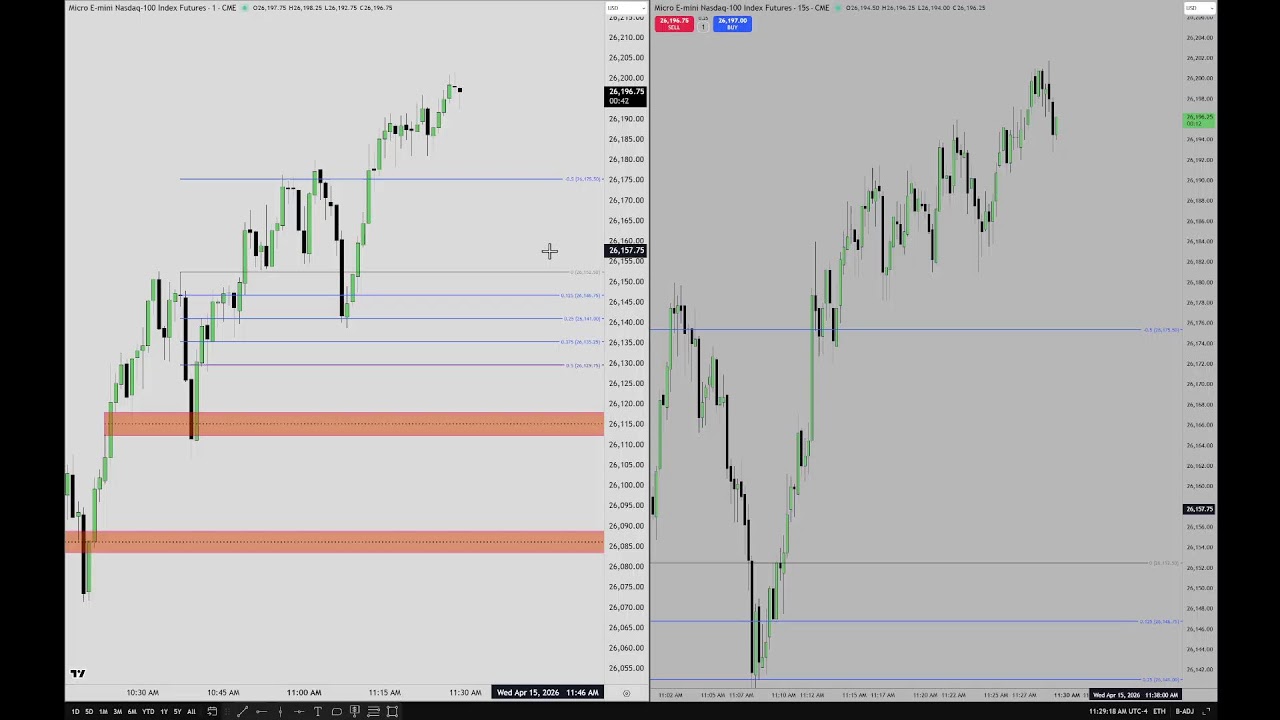
– Market context: Fed Chair testimony at 10:00 (and headlines) creates low-probability conditions for precise intraday trading. The speaker is watching MNQ (micro E-mini Nasdaq) after a 9:30 open that ran up then dropped.
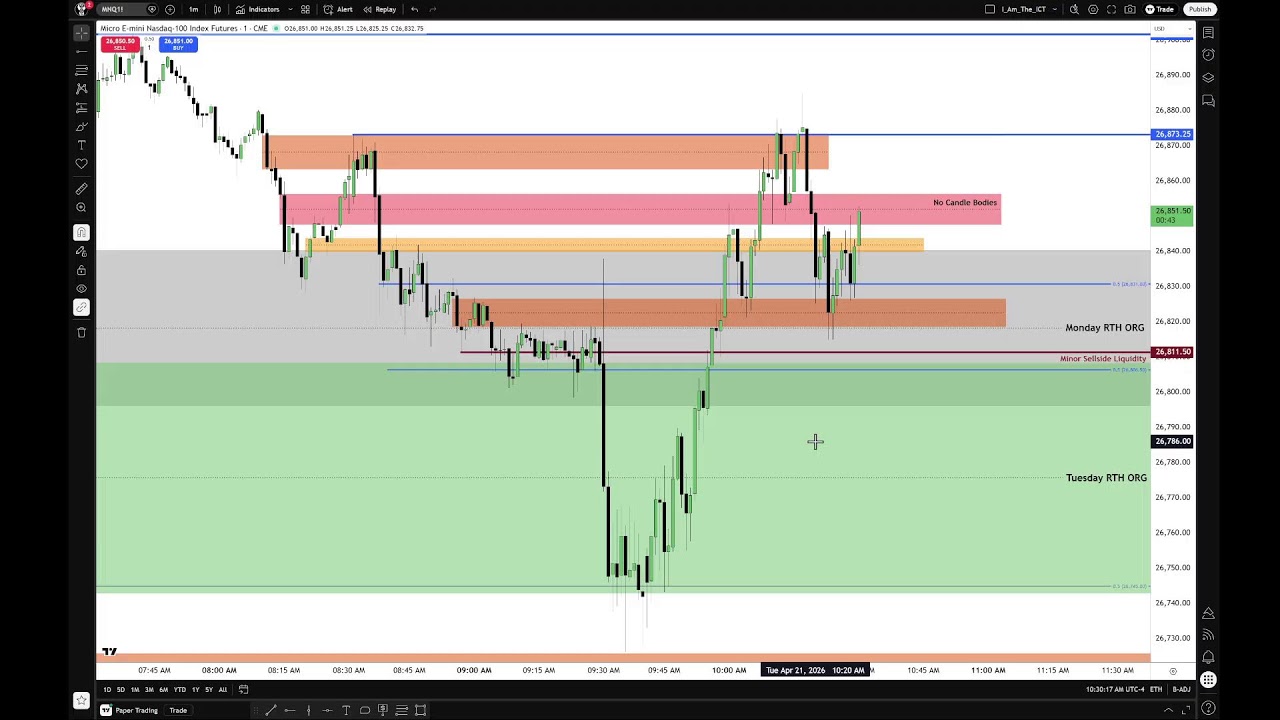
– Key technical focus: watching fair value gaps (FVGs), especially an inversion FVG and Monday’s regular trading hours (RTH) settlement/opening-range gap low (previous day 4:14 pm ET). Preference is for lower prices (short bias) with a target area near 26,695, but he acknowledges the Fed could push price higher and he won’t force participation.
– Execution notes: he was building a short between two FVGs and adding as price validated “premium sensitivity” (bodies concentrated in the lower half of a gap). He emphasizes bodies (real liquidity) over wicks, first-utilization validation of FVGs, and how inversion vs. bearish FVGs function.
– Practical rules taught:
– Use FVGs that show clear first-utilization (they prove themselves).
– If a gap acts as bearish on first use, trading above it can turn it into an inversion FVG (and vice versa).
– Order-block entry rule (candlestick selection): if the last candle in a series is the largest (or the smallest) use its open; if candles are uniform use the first (lowest) candle’s open.
– Risk/discipline points: he trades in a demo account to avoid offering regulated trade advice (not a licensed advisor), and to protect both him and viewers. He warns against copying posted levels as trade signals; instead build and test your own price-action model, and only trade when the market gives context.
– Teaching/operational notes: livestream and posting problems this morning; intends to work on entries in future lessons; time will be more limited due to family/grandparent responsibilities.
– Final advice: today is a study day—observe price action, journal objectively, don’t let social media/critics dictate trades, and only engage when your model and price action align.
– Quick personal aside about his wife shopping, then a brief, family‑friendly market review.
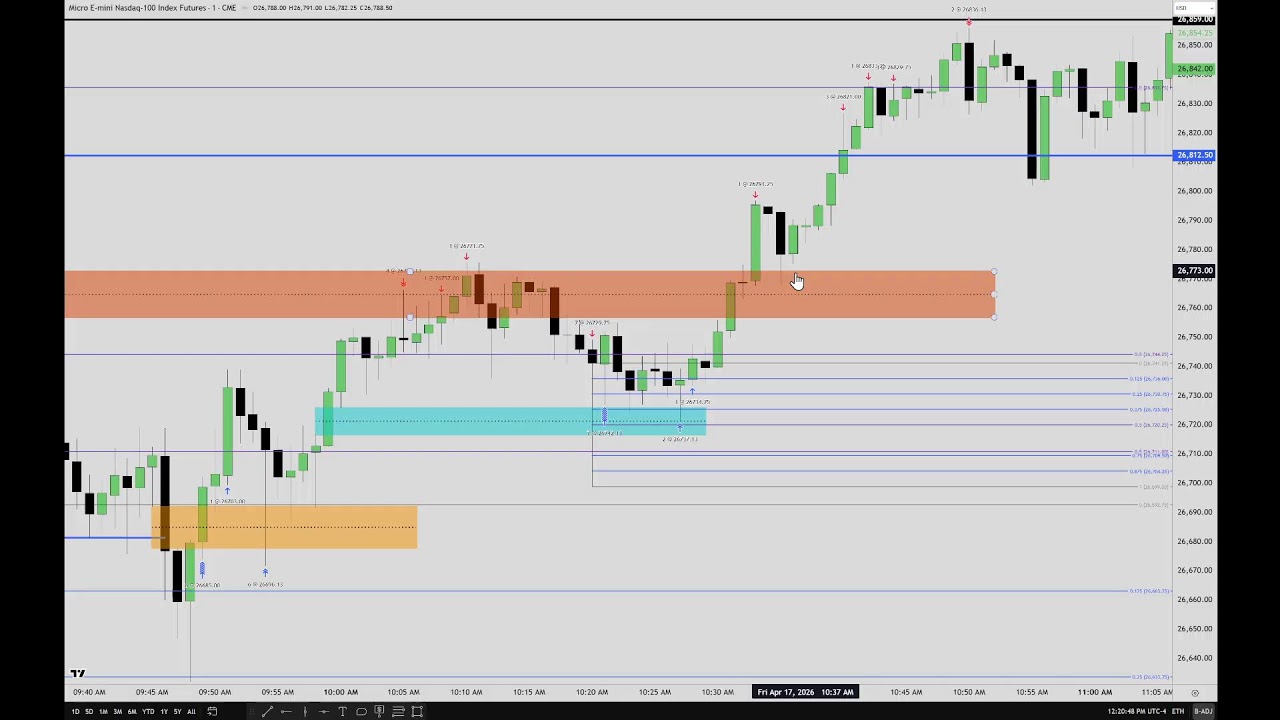
– Recap of prior analysis (end of March YouTube/Twitter Spaces): he expected a drawdown to relative equal lows with a possible intraday reversal, warned about May volatility/new Fed chair, and described targets that could accelerate to the relative equal highs if certain levels cleared.
– On the micro NASDAQ intraday, he walked through specific levels: Thursday high (~26,563), all‑time/contract high (~26,859), and the midpoint “event horizon” (~26,711). He also highlighted the regular‑trading opening‑range midpoint (consequent encouragement) and an 8:23 electronic low as short‑term draw targets.
– Streaming issues forced him to call and timestamp trades on X (Twitter); he asks followers to link those tweets to TradingView to verify the real‑time calls.
– Trade actions and rationale: he identified fair value gaps, order blocks, propulsion blocks and a “bolo” defensive PD Array, used these order‑flow visuals to go long in stages (multiple single‑contract adds), took partials at fair‑value gap extremes, raised stops, and was later stopped out by what he characterizes as a manual stop hunt (not algorithmic).
– Main claim: his technical framework (continuous contract, PD arrays, inversion fair value gaps, event horizon) produced accurate targets and worked this week; he defends his bullish positioning and rebuts critics who said he didn’t call it.
– Logistics and sign‑off: he’ll be off Monday for a long weekend, returns Tuesday, thanks his community, and signs off.
– Purpose: Quick market review before a live trading stream, focused on practical teaching for new traders (use Micro Nasdaq instead of minis to avoid excessive volatility and overleveraging).
– Market view and targets:
– Micro Nasdaq (MNQ) buy-side engaged; yesterday’s daily high was called live at 26,562.75 (claimed “to the tick”).
– Intraday objective ~26,711 (midpoint/event-horizon between liquidity pools); next larger target ~26,859.
– S&P (MES) smashed all-time highs; Nasdaq weightier but both strong.
– Dow target ~49,439 with potential acceleration intraday toward its all-time high.
– Technical approach and observations:
– Emphasis on price-action reads: opening price, high/low/close, fair-value gaps, opening-range gaps, “consequent encroachment,” discount/premium sensitivity, time-distortion accumulation, and using short timeframes (1-minute) for entries.
– He maps liquidity pools and uses an “event horizon” technique (0.5 midpoint) to project intraday targets.
– Warns Friday can produce odd behavior: moves during electronic hours might push through levels that close differently in regular hours.
– Commentary on market structure and credibility:
– Argues markets are algorithmically driven and “rigged” by market-making algorithms; claims dealers/algorithms drive price and hunt liquidity/stops.
– Defends his prior live calls and criticizes other commentators who deny algorithmic control or claim his results are cherry-picked.
– Practical notes: platform latency affected live order placement; he will call out entry/exit levels verbally when platform order entry is impractical.
Quiz
1. According to ICT, why was he looking at Micro Nasdaq instead of the mini contracts?
A. Because the micro contract has less volatility and is better for brand new students
B. Because the mini contract was unavailable that morning
C. Because the micro contract moves faster than the mini contract
D. Because he was only trading the Dow that day
Answer Key and Evidence
1. A
Evidence: “I’ve been focusing on teaching how brand new students should be watching price action… let’s be practical about this in the beginning… obviously I can trade minis, but for someone that’s brand new, it’s not advised because the volatility… Look at this. This is violent.”
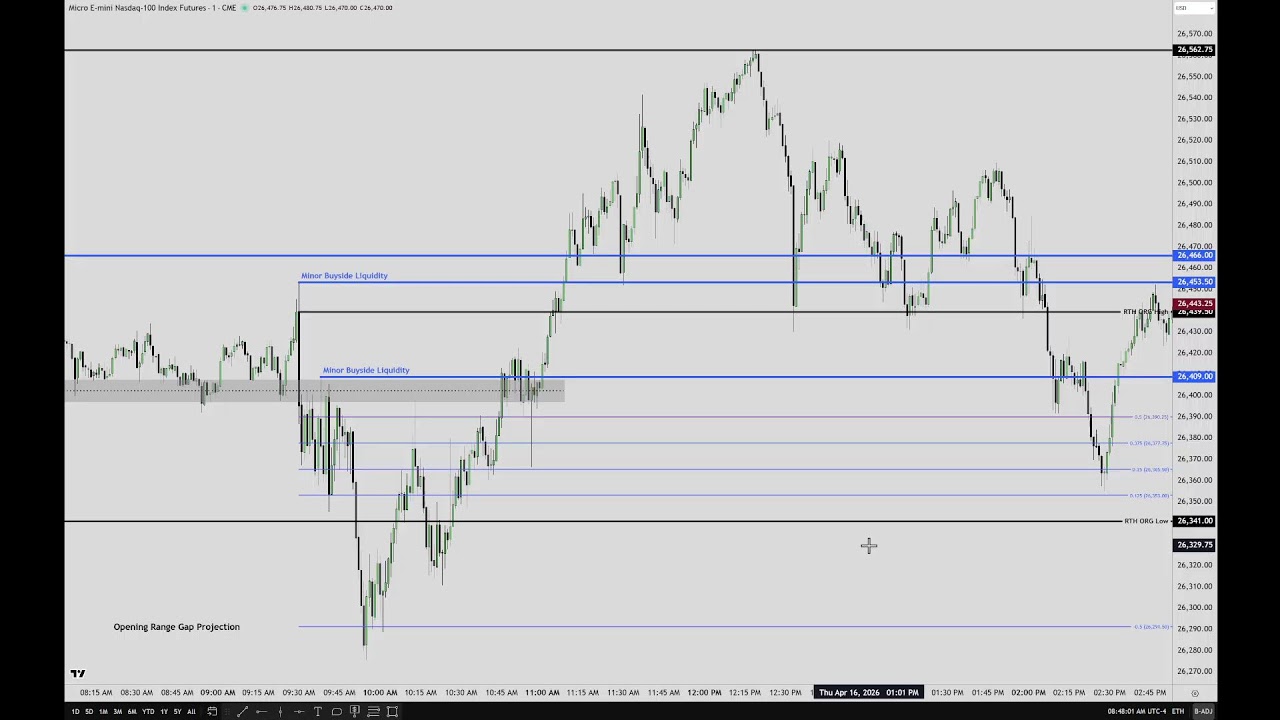
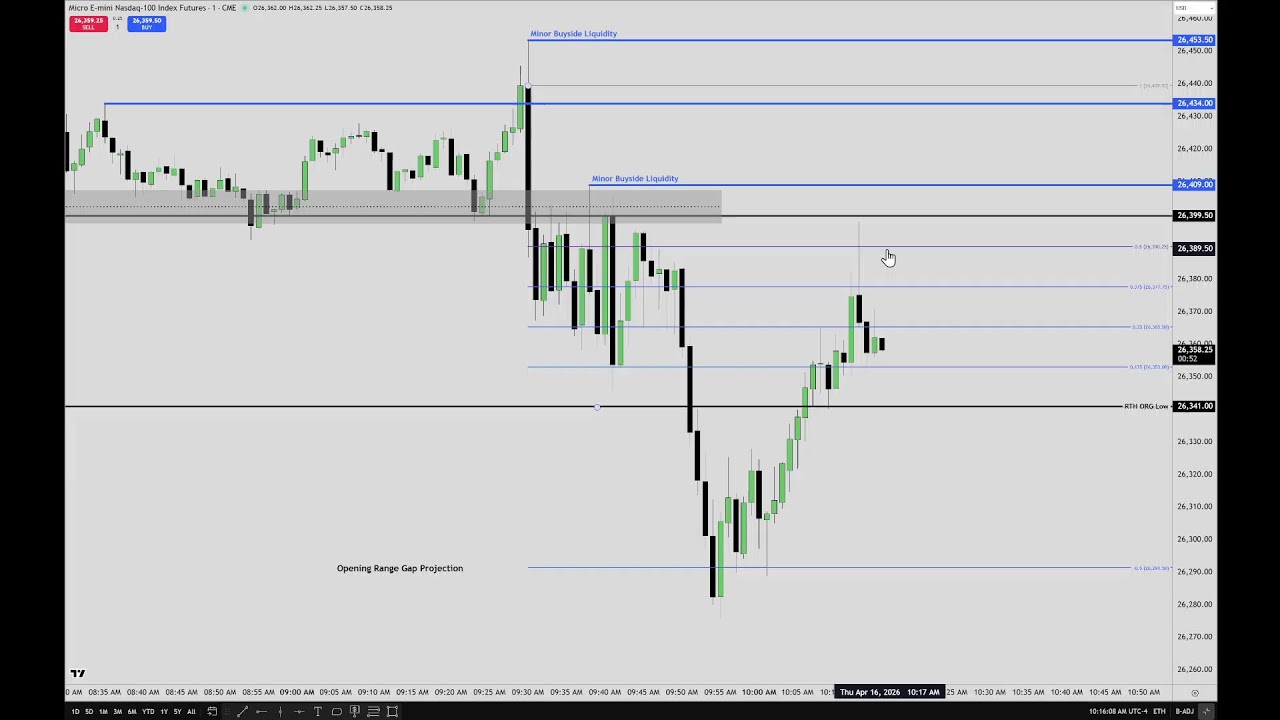
– Morning livestream focused on trading the opening-range gap and fair value gaps (FVGs). The market opened with a premium gap above the prior regular-hours settlement, giving a short/bearish bias for the first 30 minutes.
– Key tactical concepts: identify inversion FVGs, use the opening price (9:30) and the regular-hours settlement to mark the opening-range gap, watch for consequent encroachment (half-gap) — ~70% probability of a move to the half-gap — and use a negative 0.5 projection outside the gap as a target if price breaches it.
– Practical execution: stage levels before open, wait for the first presented FVG, use if-then rules, and treat the first 30 minutes as the most important timeframe for morning context.
– Coaching philosophy: new traders should do many executions for ~4–8 weeks to desensitize to outcomes, study winning vs losing setups to identify repeatable signatures, and avoid shortcut-seeking. With experience, a 1:1 risk:reward model can be profitable. – Live-demo issues: the presenter experienced significant TradingView lag and poor fills, which interfered with entries and management — a reminder to use reliable execution platforms. – Behavioral advice: make trading enjoyable, keep clear parameters, and focus on disciplined observation and repetition rather than chasing shortcuts.
Quiz
1. What did ICT say about the first 30 minutes of trading? A. It is not important compared with the lunch session B. It only matters when using a 5-minute opening range C. It is highly important and gives the rhyme and reason for the morning session D. It should be ignored until the afternoon session
Answer Key with Evidence
1. C Evidence: “That first 30 minutes is going to give you the rhyme and reason for the entire morning session” and “The first 30 minutes of trading, highly highly important. That’s the opening range.”
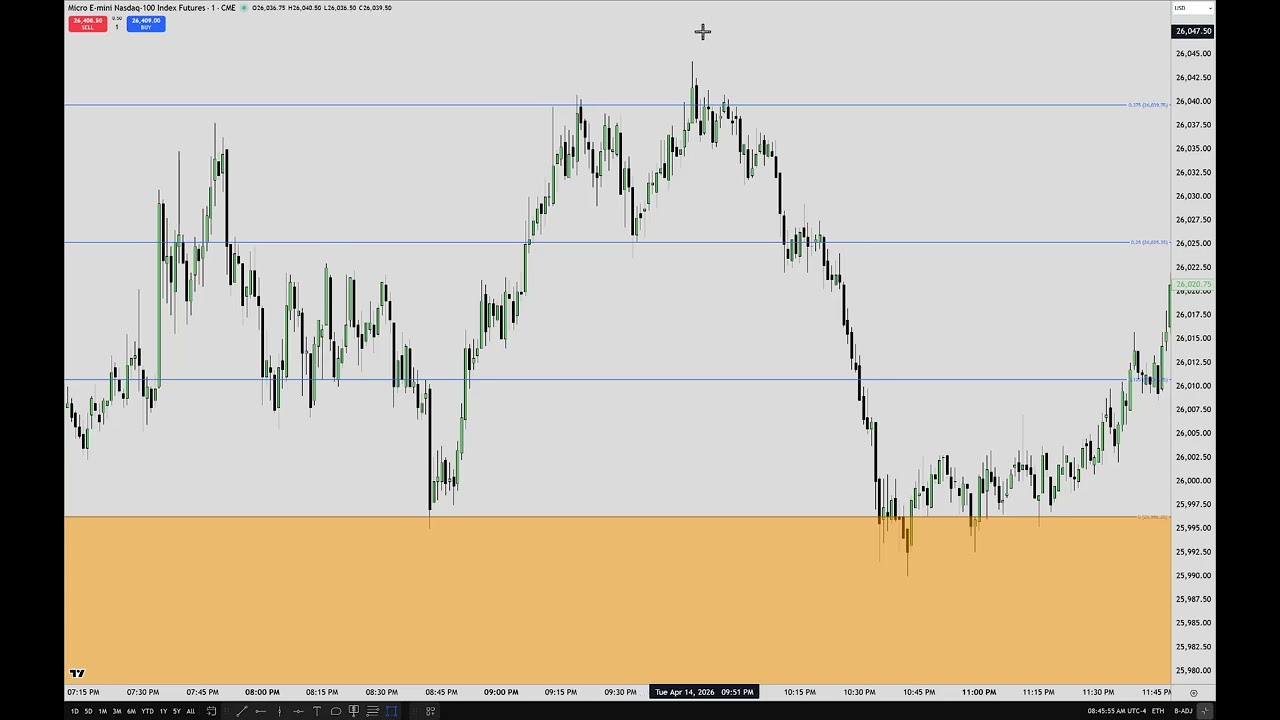
ICT reviews an Asian-session trade they shared on X, explaining the setup, execution, and rationale. Working off a macro window around 9:50–10:10 and using daily as their highest actionable timeframe, they identified a key wick/premium area and an inversion/fair-value gap (FVG) as a higher-timeframe turning point. Dropping to a 1-minute chart they hunted a Turtle-Soup–style entry into two stages of buy-side liquidity, then used a bearish FVG to short into deeper liquidity pools. They recorded the entire trade live (not market replay) and posted it for verification. They scaled out with partials near the swing low and closed the remainder near the targeted liquidity; price later reclaimed the lower FVG and rallied. Main lessons: treat wicks/gaps and FVGs as important levels, combine higher- and lower-timeframe context, and manage entries/exits into liquidity.
– This was a live trading “drill” session meant as practice, not trade advice. The instructor repeatedly warns viewers not to copy these live examples with real money and to use demo/paper accounts for drills.
– Focus and method: working mainly on 1-minute charts with a sub‑1‑minute executable frame (15‑second) to practice entries into fair value gaps (today) and order blocks (upcoming). The aim is to learn how to spot small inefficiencies, liquidity pools, relative equal highs/lows, and consequent encroachment.
– Objective and trade sizing: treat drills like “leg day” — uncomfortable but necessary. Target small, low‑risk moves (roughly 10–15 handles), use a one‑for‑one model, place stops, and accept that outcomes don’t matter for the exercise.
– Mindset and psychology: primary goal is to desensitize to fear/need-to-be-right. Record emotional reactions, keep a journal, narrate and review your screens, and build repetition/experience rather than seeking instant profits or highlight trades.
– Market commentary: the session’s market was “sloppy,” choppy and fast, with decoupling between indices and occasional order-fill glitches on TradingView. Such hard conditions are exactly where practicing is most useful.
– Practical tips: do drills for short periods (15 minutes/day minimum), screenshot glitches/fills, record yourself narrating price action, focus on process not outcomes, and keep edge sharp by ongoing practice even after profitability.
– Final point: there are no shortcuts — consistent practice, honest journaling, and accepting short‑term failure are required to develop reliable trading skills.
Quiz
1. According to ICT, what should traders do when there is nothing on the chart to work with?
A. Enter anyway to stay active
B. Wait and do nothing
C. Increase position size
D. Trade the opening bell only
2. What did ICT say is the purpose of these drills?
A. To make money quickly
B. To build a highlight reel for social media
C. To practice participation in price action without fear or money pressure
D. To predict every market move correctly
3. What target range did ICT repeatedly say he was looking for in these drills?
A. 1 to 3 handles
B. 5 to 8 handles
C. 10 to 15 handles
D. 25 to 30 handles
4. What did ICT say about using live trading accounts for these drill examples?
A. They are meant to be copied directly into funded accounts
B. They should only be used on futures contracts
C. They are not trade entries to copy into live or funded accounts
D. They only work during the London session
5. What market condition did ICT say would make him reluctant to participate?
A. Clean price action with open traffic
B. Fast, loose, low resistance liquidity run conditions
C. Messy, choppy, range-bound price action with shared candle ranges
D. A market with large clean imbalances and expansion
Answer Key with Evidence
1. B. Wait and do nothing
Evidence: “So if you have nothing to work on, you sit still.” He also said, “If there’s nothing in the chart, don’t force it.”
2. C. To practice participation in price action without fear or money pressure
Evidence: “You’re just simply looking for something to engage with to get accustomed to the watching price action… You got to get that baseline foundation of experience. And don’t be afraid.” Also: “Drills are simply looking for small little participations in price action with no monetary hope of making money and no fear of losing.”
3. C. 10 to 15 handles
Evidence: “think about how, say for instance, 10 to 15 handles. Okay? So, that’s a really good small low-hanging fruit objective to look for”
4. C. They are not trade entries to copy into live or funded accounts
Evidence: “please don’t take these as trade entries for you to put on your funded accounts. Do not try to copy them for your live account trading. If you’re here to do that, I promise you I’m going to hurt you.”
5. C. Messy, choppy, range-bound price action with shared candle ranges
Evidence: “when the candlesticks are all parked next to each other it’s like you trying to go northbound or southbound on interstates. And it’s frustrating.” Also: “When it’s like that… you’re more prone to see a lot of continued consolidations.” He described it as “high resistance liquidity run conditions” and “very messy.”
– Hosting a live tape-reading session focused on price action around the regular trading-hours opening range and the opening gap. The main technical hooks: opening range gap, consequent encroachment, fair value gaps (FVGs), inefficiencies, and buy/sell liquidity pools. – Market context: peace negotiations failed over the weekend (geopolitical risk), which created a big gap lower at the open. ICT remained neutral and observational—no trade taken—because price action was ambiguous and low probability. – Key technical thesis: watch whether price reclaims the consequent encroachment and closes the full gap. If it closes and accelerates higher, the speaker expects continuation up; if bodies close into the upper half of inefficiencies or fail to reject key levels, that supports a bearish retracement. – Practical entry criteria: prefer one‑sided, high-probability setups (clear imbalances, reclaim/inversion FVGs, confirmed lower‑timeframe FVGs). Don’t trade “tries” or guess—wait for confirmation on the body close, not just wicks. – On stop hunts and liquidity: algorithms hunt stops and engineered liquidity; recognize stop hunts and then look for opposing liquidity as the next target instead of panicking. – Teaching focus: live demonstration of tape reading in difficult/mixed conditions to build anticipatory skills rather than reactive guessing. Emphasis on learning to identify warning signs (“canary” analogy) when price is reluctant to behave as expected. – Process advice: take shorthand notes while watching, later annotate charts and keep a study/journal of observations, emotions and outcomes. This builds experience and improves anticipation. – Psychological guidance: accept uncertainty; don’t force trades for ego or social media clout. Avoid copying signals or chasing influencers who “try” trades without conviction. – Performance goal: aim for repeatable, high-probability setups (targeting ~70%+ edge), not constant activity. Expect to sit out many sessions until criteria align. – Macro view: speaker expects cleaner, more one-sided markets when a new Fed chair is installed, which could draw sidelined money back in; but current event-driven volatility requires extra caution.
Overall: read price action patiently, rely on clearly defined FVG/imbalance criteria and lower‑timeframe confirmation, journal everything, and only trade when the market shows one‑sided, high‑probability behavior.
Quiz
1. According to ICT, what is a warning sign that a trade setup may have lower probability? A. Price immediately respects the PD array and runs in the expected direction B. Price hesitates, wicks around, and does not show one-sidedness C. Price moves cleanly with strong follow-through D. Price closes beyond the expected target
Answer Key with Evidence:
1. B — “If you can see the PD arrays in price action and they’re not really adhering to the logic… that’s usually indicative of a lower degree of probability in your favor.” Evidence: “If you can see the PD arrays in price action and they’re not really adhering to the logic that would be implemented with them as I teach it, that’s usually indicative of a lower degree of probability in your favor.”