
– ICT reviewed a recent trade call centered on a “suspension block” and a bearish “breaker” on daily charts, which anchored liquidity targets. The June delivery contract target (~25,715) and the continuous contract target (~25,495) were identified and hit using the morning PPI print as the catalyst.
– Key lesson: once targets are reached, don’t rush back in chasing more gains (“sugar high”). Be willing to be content with achieved objectives and study price action instead of forcing trades.
– Suspension block / breaker analysis: compare delivery-month vs continuous contracts (they can show different nearby targets). Anchor to these structural levels to identify where large pools of liquidity likely reside.
– TGIF method (weekly-range behavior): watch Thursday 1 p.m. ET into Friday for intra-week highs; typical retracement into the remainder of the week is about 20–30% (occasionally up to ~40%) of the weekly range. If that retracement doesn’t occur, watch the following Monday for follow-through.
– Order-flow and price-action emphasis: use candlestick bodies, wicks, and fair value gaps to read institutional order flow—no paid indicators or fancy heatmaps required. Examples: closing bodies above the midpoint of a gap and staying in the upper half indicates bullish institutional control.
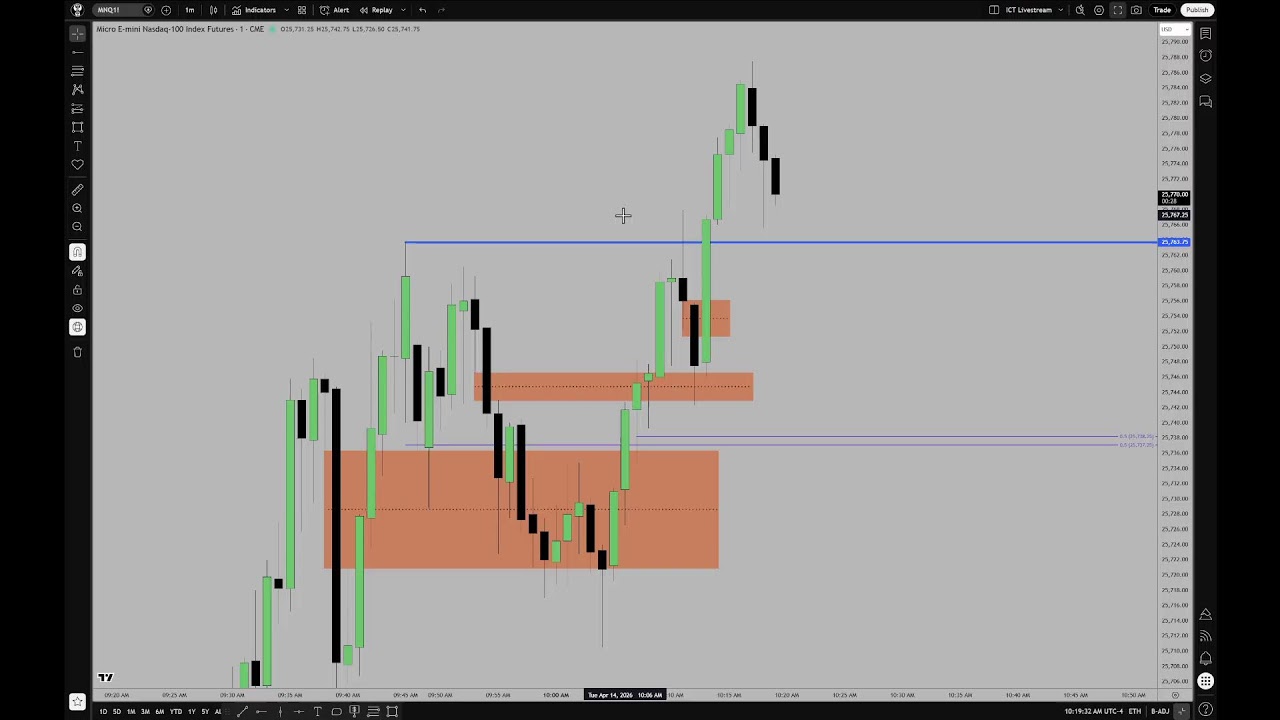
– Multi-timeframe practice: annotate key liquidity pools on daily/weekly charts, then confirm on 1‑minute, 30s or 15s charts. Small-timeframe structure (body positions, fair value gap fills, consequent encroachments) gives actionable feedback.
– Cross-index context: monitor correlations among Nasdaq (NQ), S&P (ES), and Dow to time entries and understand where liquidity may draw other indices (weakest index often leads directional moves).
– Practical advice: focus on one market to develop skill and reduce noise, screenshot and journal your annotated levels, test the patterns in demo trading, and study price action repeatedly—don’t rely on mysticism, paid black boxes, or random indicators.
– Meta points: patterns repeat (likely influenced by algorithmic activity), so learning these signatures gives an edge; the stream’s goal is to teach reading price and probability, not to push immediate trade signals.
Quiz
1. According to ICT, what kind of news events create “nice little obvious magnets on prices”?
A. Earnings reports
B. Red folder or orange folder high/medium impact economic news
C. Political speeches
D. End-of-day close announcements
2. What does ICT say TGIF generally does to the weekly range?
A. Retraces 80% to 90% of the range
B. Retraces 50% of the range
C. Retraces 20% to 30% of the weekly range
D. Never retraces at all
3. What did ICT say to do after price hits your targets?
A. Immediately double your position
B. Rush back in to catch the next move
C. Be content with enough and not chase another “sugar high”
D. Ignore the chart and stop studying
Answer Key with Evidence:
1. B. Red folder or orange folder high/medium impact economic news
Evidence: “Whenever you have news, red folder news like today’s PPI, last Friday’s CPI, non-farm payroll, FOMC… if it’s a red folder event or a orange folder, so it’s a high impact news driver or if it’s a medium impact news driver, those create nice little obvious magnets on prices.”
2. C. Retraces 20% to 30% of the weekly range
Evidence: “It usually retraces 20 to 30% of the weekly range…”
Evidence: “generally you’ll get a retracement up to 20% to 30%.”
3. C. Be content with enough and not chase another “sugar high”
Evidence: “once it hits your targets, why rush back in? Because the only reason why you’re trying to do it is you’re trying to get another sugar high.”
Evidence: “learning to be content with enough, learning to say, ‘Okay, I’ve done enough.’”
Leave a Reply