
https://www.youtube.com/watch?v=IF7dEkgWoO0
Summary:
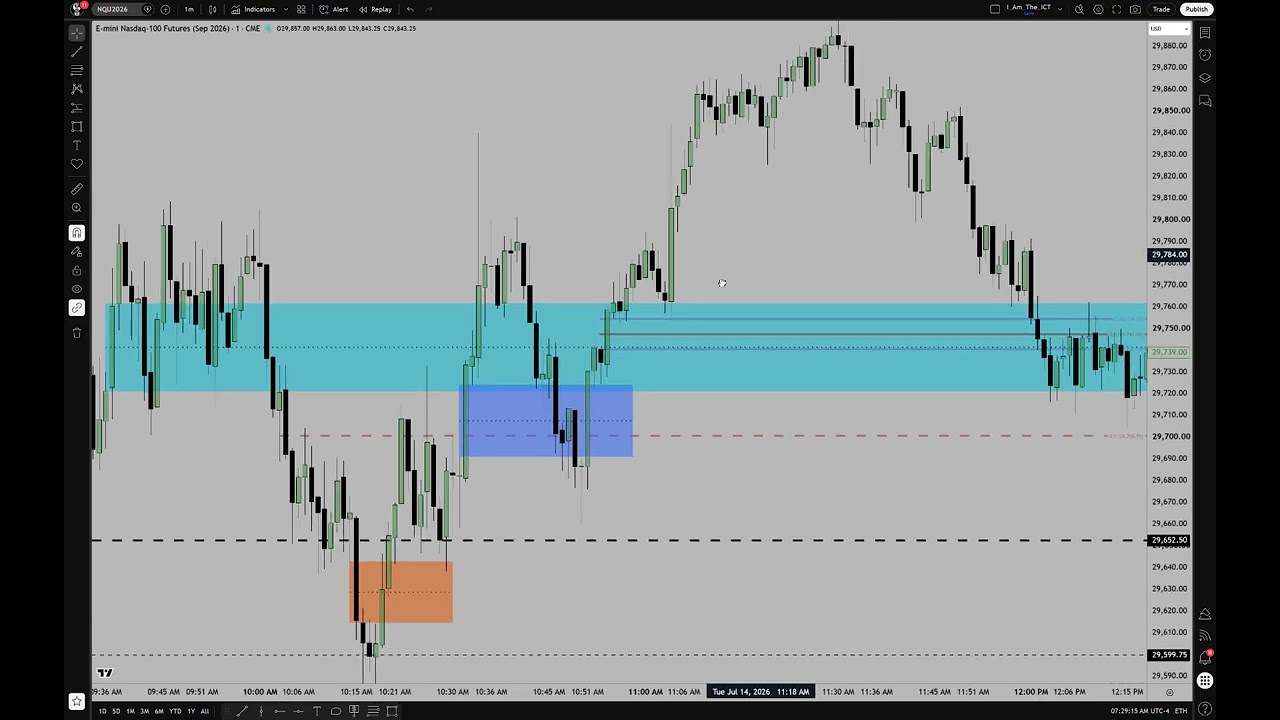
– The speaker reviews recent price action around levels he flagged earlier (including a sweep near 29,395 and a prior low ~29,545), explaining how the CPI print drove a rapid move and created actionable liquidity and fair-value gap (FVG) situations.
– He describes trades taken: short entries into a suspension/first-presented FVG, partial exits to target measurements, a final contract stopped out (small loss acceptable), and how subsequent wicks, closes and fills changed the character of various FVGs (inversion → reclaimed/bullish).
– Key technical themes: liquidity sweeps, relative equal highs/lows, suspension/first-presented FVGs, breaker/order block behavior, and institutional entry drills — all used to judge whether lower or higher prices were likely.
– Market structure shifted bullish when candles failed to close below certain wicks and when an inversion FVG was not confirmed; price later rallied into and interacted with the new-week opening gap and other liquidity pools.
– Near-term outlook: he expects possible continued upside (unfinished business higher) but also notes a vulnerable “single toothpick” candle supporting much price — that area may be traded before week’s end. PPI (and other major data) could produce a two-stage move (drop then rally) or trigger a breakdown if a rally fails.
– Trading advice: don’t rely solely on him — form and test your own models, compare your analysis to his to learn, and treat major news events (PPI/CPI/FOMC/NFP) with caution — wait for high-probability setups rather than forcing trades.
– He points viewers to his YouTube/live executions for real-time examples and says he’ll follow up later with more commentary.
Leave a Reply