
https://www.youtube.com/watch?v=V5crdCw0AsY
Summary:
The speaker explains the “chain of custody for price”—how price moves between high-probability PD (price discovery) arrays—by using visual, mathematical tools rather than retail myths (support/resistance, generic supply/demand). Core concepts:
– Markets are algorithmic and autonomous; short disruptions happen, but price delivery follows structural imbalances.
– Identify and grade inefficiencies (buy-side imbalances, sell-side inefficiencies, suspension blocks) on higher timeframes (daily/weekly). Grading creates octant/quadrant/gradient levels to guide lower-timeframe analysis.
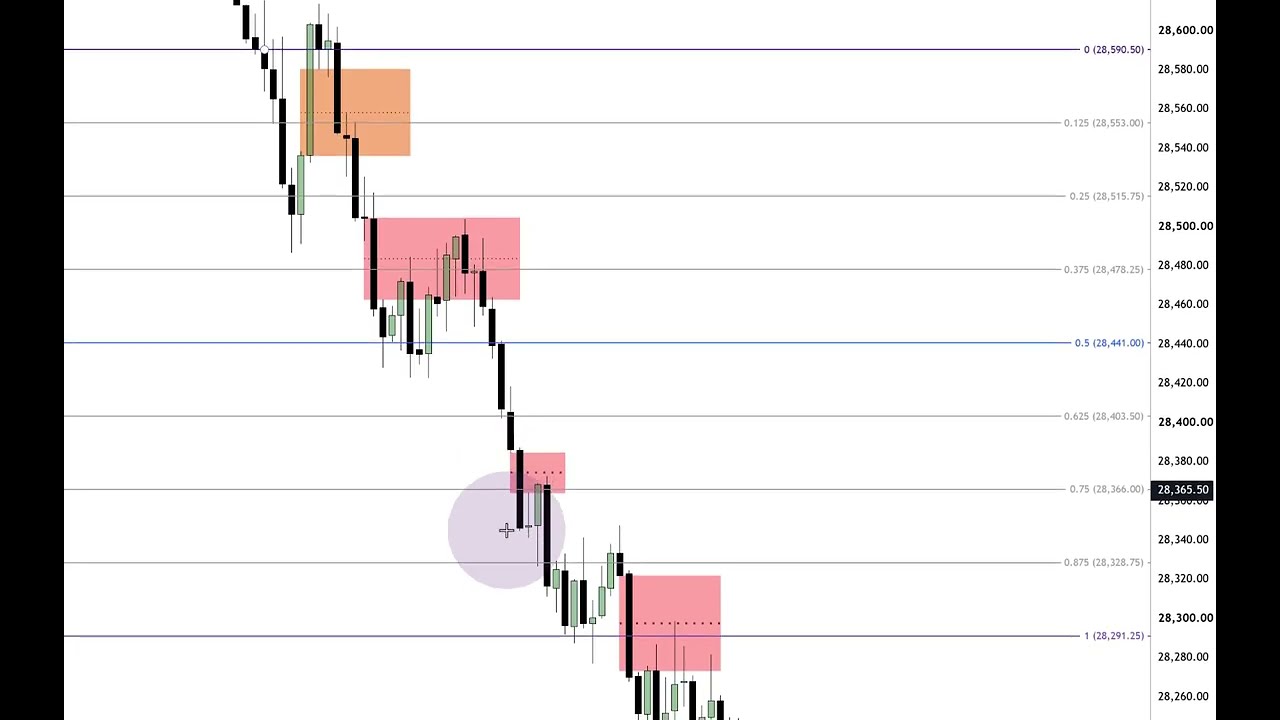
– Use the regular trading hours opening-range gap (OR gap) as a precise intraday reference (anchor Fib to the higher of the 9:30 candlestick open/close and use the prior session’s final print for the low). Map octant/quadrant levels inside that graded gap.
– Spot fair value gaps (FVGs): the three-candle pattern where candle two creates the gap. Note first-utilization FVGs (direction of original use) and inversion FVGs (when price later trades through and reverses their logic).
– A breakaway gap (inefficiency around the midpoint of your analysis that never trades back into) signals strong continuation in that direction.
– Trade higher-probability setups where time, price, your directional bias, and multiple PD arrays/graded levels agree—more overlapping signals mean a greater likelihood price moves as expected.
Bottom line: grade inefficiencies, align timeframes and OR gap octant/quadrant levels, watch FVG behavior and overlaps of PD arrays; when multiple tools agree, you get higher-probability price movement.
Leave a Reply