
https://www.youtube.com/watch?v=J9G1j3-e1GU
Summary — key points
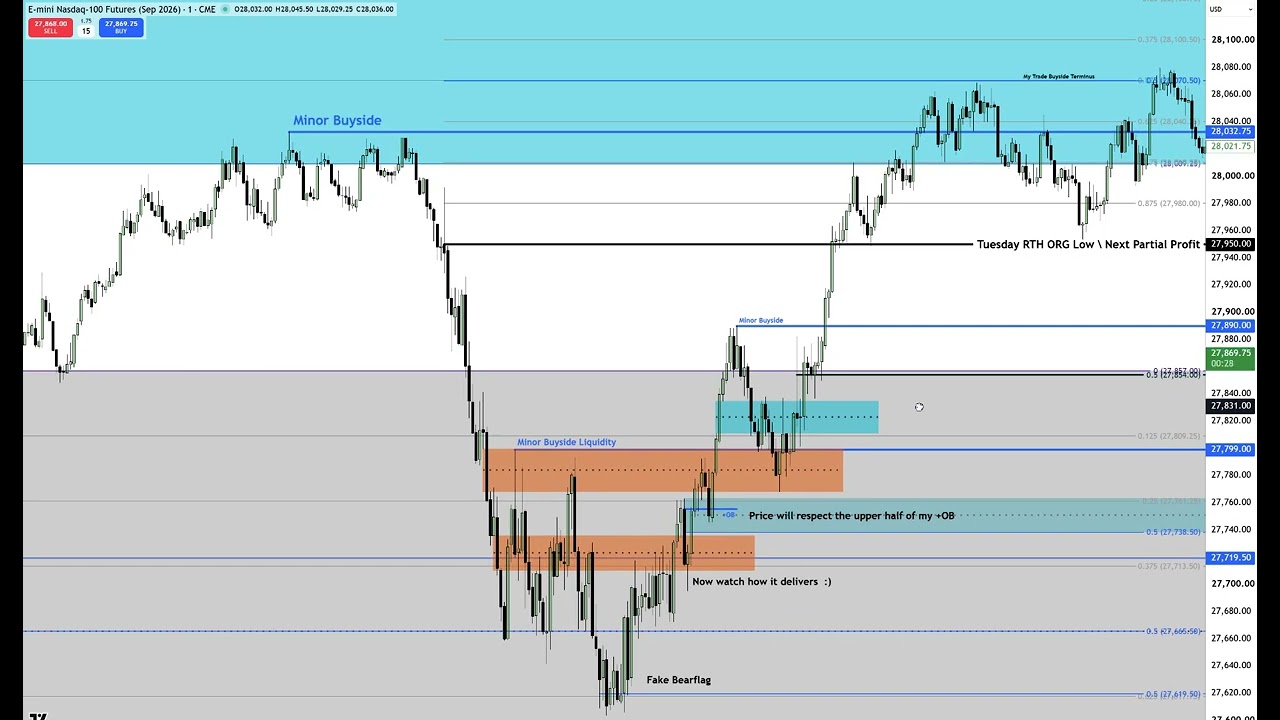
– Daily chart: price reached the author’s downside objective and created a bullish order block / deep-discount suspension block with an inefficiency. That zone (around 27,665.5) is a likely bounce area; even if price keeps falling, it’s a good hunt for a low-risk buy.
– Intraday (1‑minute): the move formed a market‑maker buy model — probes lower to collect sell‑side liquidity, prints a wick/reversal and then reaccumulates, which led to a rally toward the planned target.
– Trade execution: the author entered aggressively below the wick midpoint with 3 contracts, planned to scale into partials (including around the 9:30 RTH open), and saw the price reach the intended levels but could not fully manage the position.
– Personal interruption: he had to leave due to a family medical emergency (sister‑in‑law with pregnancy complications), so he recorded the whole session and later uploaded an unedited, real‑time video.
– Teaching points and follow up: emphasizes studying full real‑time footage (not just sped‑up clips) to learn market‑maker buy/sell models, fair‑value gaps, reaccumulation, etc. Promises further demonstration later in the day.
Leave a Reply