Category: ICT YouTube

  • Part 1 \ High Precision Secrets To Intraday Price Action

    Part 1 \ High Precision Secrets To Intraday Price Action

    https://www.youtube.com/watch?v=DRTvbkKmuAw

    – Opening remarks and brief apology for a distracted recording; personal anecdote about family and a live-stream discussion.
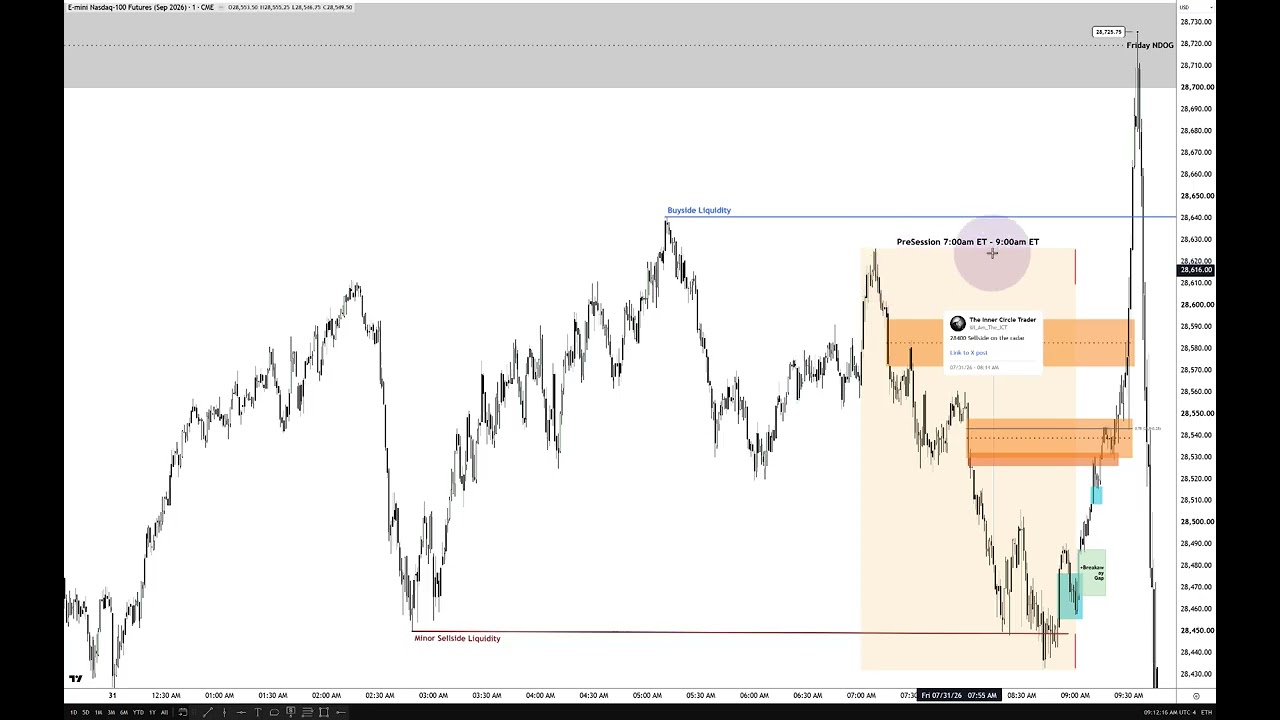
    – Core trading idea: focus on a specific, finite pre-market time range (pre-session 7:00–9:00 a.m. ET). Treat that window as the primary data sample for the regular session.
    – Methodology: anchor a Fibonacci to the highest high and lowest low inside the 7–9 a.m. range, then project precise horizontal price levels (quadrants/octants, midpoints) forward as key reference points.
    – Key price-structure concepts used: buy-side imbalances / sell-side inefficiencies, inversion fair value gaps, breakaway gaps, consequent encroachment — all tethered to specific candles and the time-based range.
    – Practical rule: levels must be precise and time-anchored (not vague “zones”); trades are anticipatory (based on those specific levels and the 9:01+ behavior), not reactive.
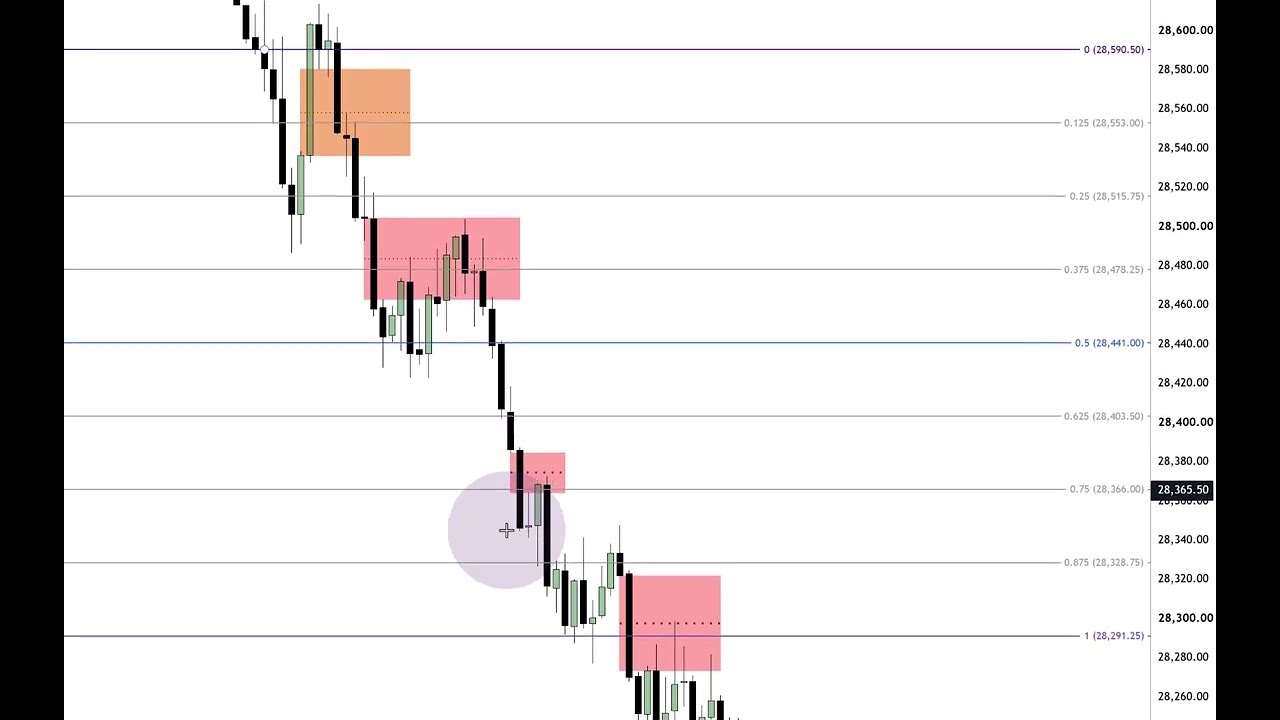
    – Example: he publicly identified and shorted the daily high in a recent session, targeted ~28,400, and the market reached the projected area—used to demonstrate the method’s predictive value.
    – Broader approach: use the last 3 days for intraday low/high projections; combine daily and intraday references (wicks, opening gaps) to refine targets.
    – Teaching philosophy and criticism: urges students to study and verify (not blindly trust), defends against trolls/copycats, and stresses the mental effort and discipline required to master the method.
    – Summary takeaway: a time-anchored, level-specific framework (pre-market 7–9 a.m. + precise technical constructs) yields high-probability, anticipatory trade setups when applied consistently.
  • Market Review NQ July 31, 2026

    Market Review NQ July 31, 2026

    https://www.youtube.com/watch?v=uws9egBxPLI

    – Instructor opened with a short review and logistics (may post more content on YouTube; translations can be limited if videos exceed an hour).
    – Market recap: price rallied into last week’s Friday volume imbalance, then after FOMC retraced into the same imbalance; weekly low held and price followed through to near the week’s start.
    – Teaching focus: a methodology combining market structure, time-and-price grids (PD arrays, octants/quadrants), and strict criteria for using fair value gaps/inefficiencies and volume imbalances — not just visual guesses.
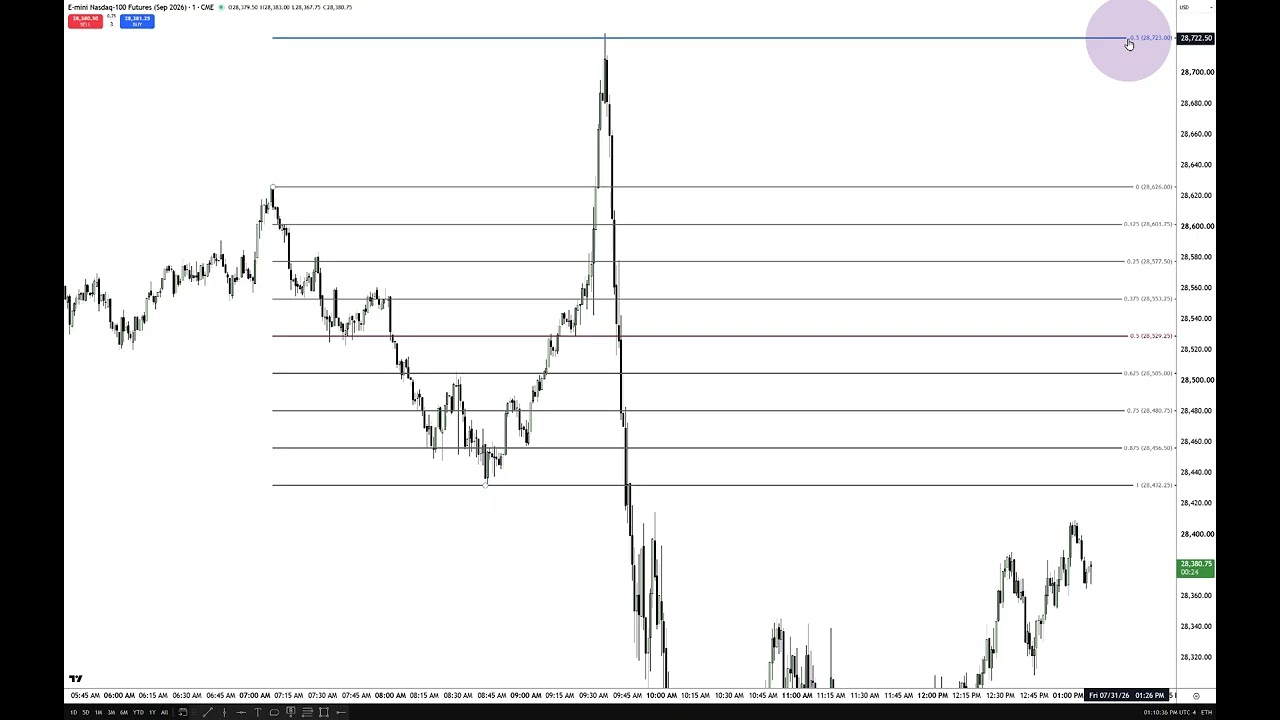
    – Key tactical framework: use the pre-market “dealing range” (7:00–9:00 ET) and the opening range (9:30–10:30 ET) to build time-based horizontal levels; project range extensions (notably the 0.5 fib) to forecast likely session highs/lows.
    – Examples given: specific levels (e.g., 28,400) and how buy-side imbalances / sell-side inefficiencies aligned with octants and algorithmic times (8:30, 8:50–9:10) to produce predictable reactions.
    – Execution tips: enter small “information” contracts to read order flow (even 1-second candles), use demos or micros to test, and scale into trades when price confirms.
    – Emphasis on experience: the system requires practice; the teacher criticizes shortcuts, rebranding by others, and says experience cannot be simply transferred.
    – Personal anecdote: he traded the setup (shorted near the projected high, hit target around 28,400), describing trade management lessons and minor execution errors.

  • ICT Algorithmic Time & Price Grids

    ICT Algorithmic Time & Price Grids

    https://www.youtube.com/watch?v=4SJlJdIANCo

    Summary:

    – He reviews the NASDAQ September futures move: an aggressive sell-off at open followed by a fast, efficient rally into a daily-level target, driven by intraday order flow and algorithmic programs.
    – Key technical framework: daily “suspension blocks” (shaded blue/gray), octants/quadrants, PD arrays, order blocks, fair value gaps (FVGs) and “buy/sell efficiency” cells. These layered levels anchor where price will turn or continue.
    – Important price-action rules he uses: bodies staying in the upper half of a candle = bullish; wicks probing but not closing below midpoints = accumulation; stop-hunts clear retail stops before directional moves; measuring wicks and candle midpoints predicts strength/ failure.
    – Time structure matters: he applies a horizontal/vertical time-price grid (macro start times, top-of-hour/macro closes like 10:50 and 11:10) to anticipate where turns and PDAs will form.
    – Examples from the session: opening above short-term highs, stop-hunt to take out stops, accumulation in an order block anchored to a daily octant, then a rapid buy program that produced big moves into the daily suspension-block high; later formation of inversion FVGs and retracements that validated his rules.
    – Methodology emphasis: predict from repeating algorithmic signatures rather than react; learn the specific language/criteria he teaches, backtest, then tape-read live; one PDA at a time before mastering others.
    – Critique of common alternatives: he rejects generic “supply/demand” or momentum-chasing approaches and market randomness claims, arguing markets are algorithmic and can be read with precise rules.
    – Teaching philosophy: encourages discipline, independent thought, patient practice, and money management. The goal is to internalize his methods so students can trade independently.

    Bottom line: he argues the day’s action confirmed his layered price/time framework and rules for reading order flow, and he stresses learning that language and discipline to predict rather than react.

  • Predicting Session Low & High With Executions

    Predicting Session Low & High With Executions

    https://www.youtube.com/watch?v=J9G1j3-e1GU

    Summary — key points

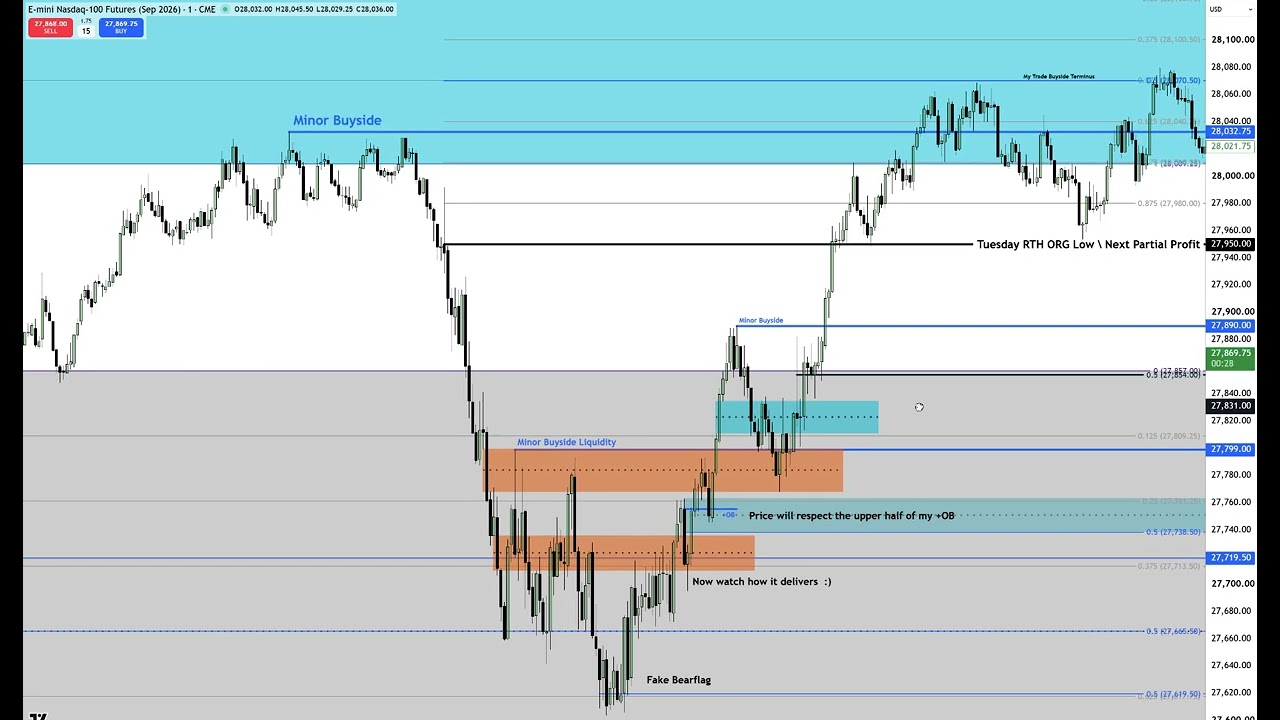
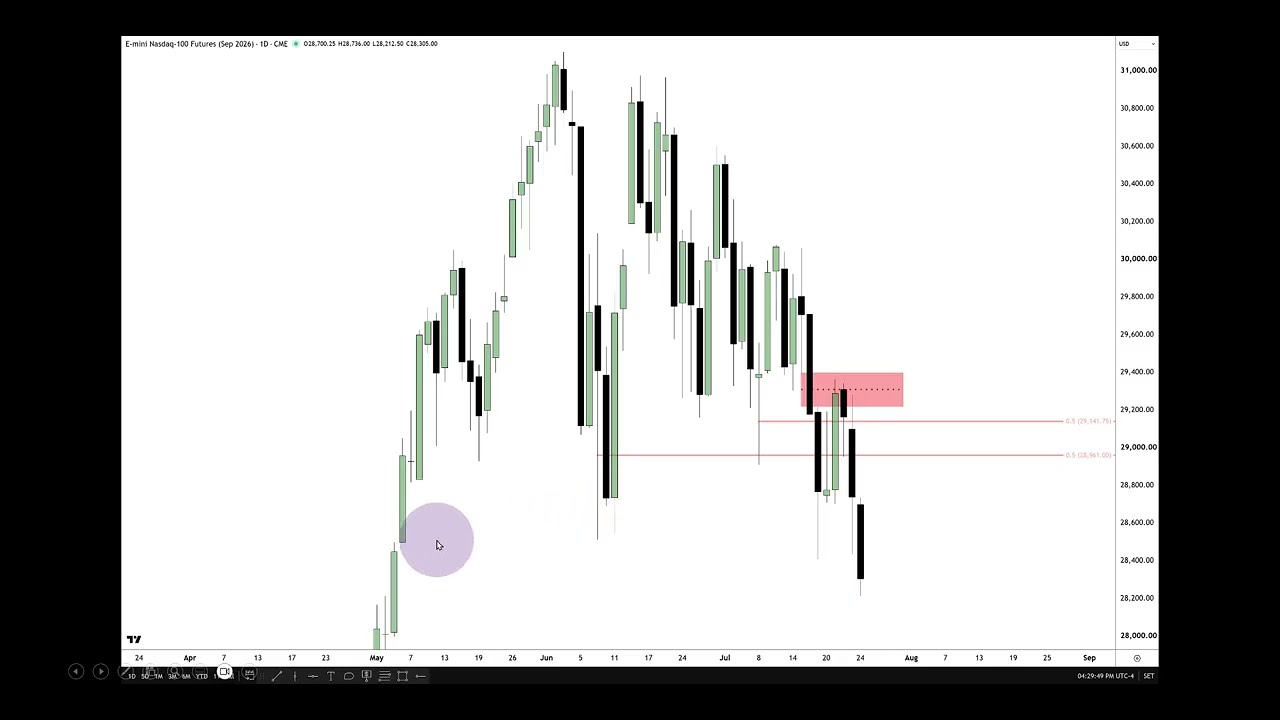
    – Daily chart: price reached the author’s downside objective and created a bullish order block / deep-discount suspension block with an inefficiency. That zone (around 27,665.5) is a likely bounce area; even if price keeps falling, it’s a good hunt for a low-risk buy.
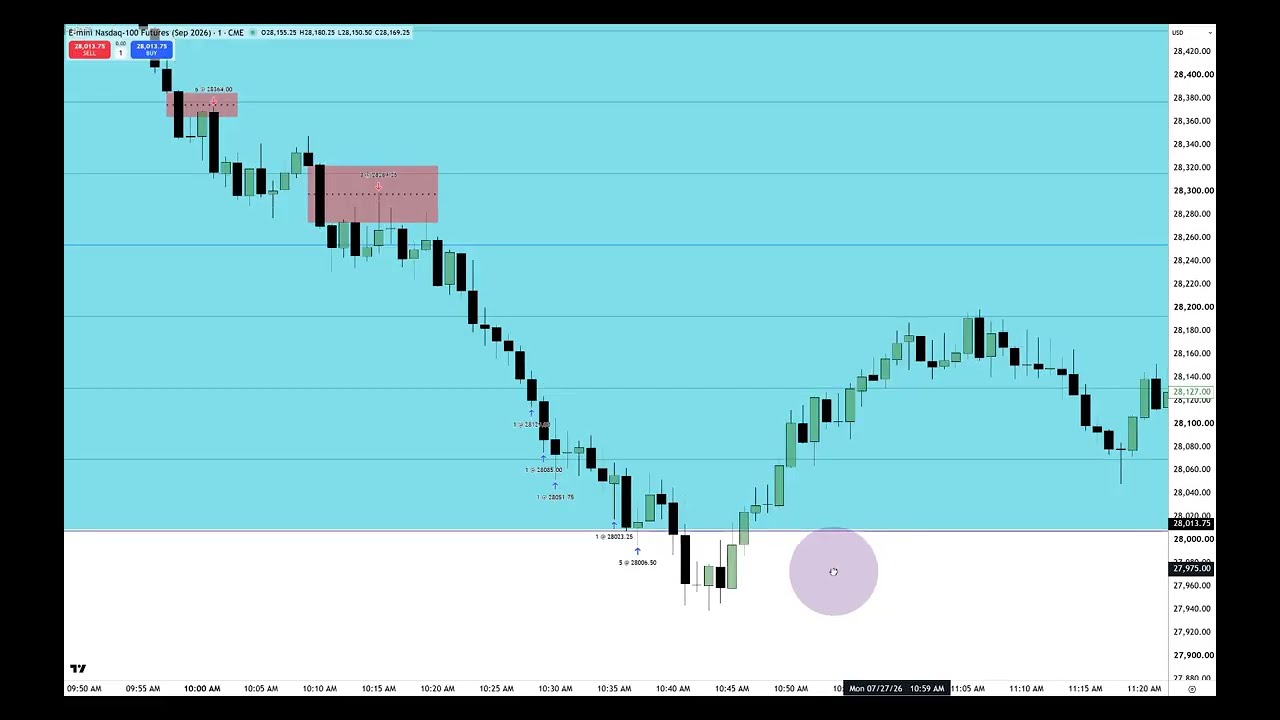
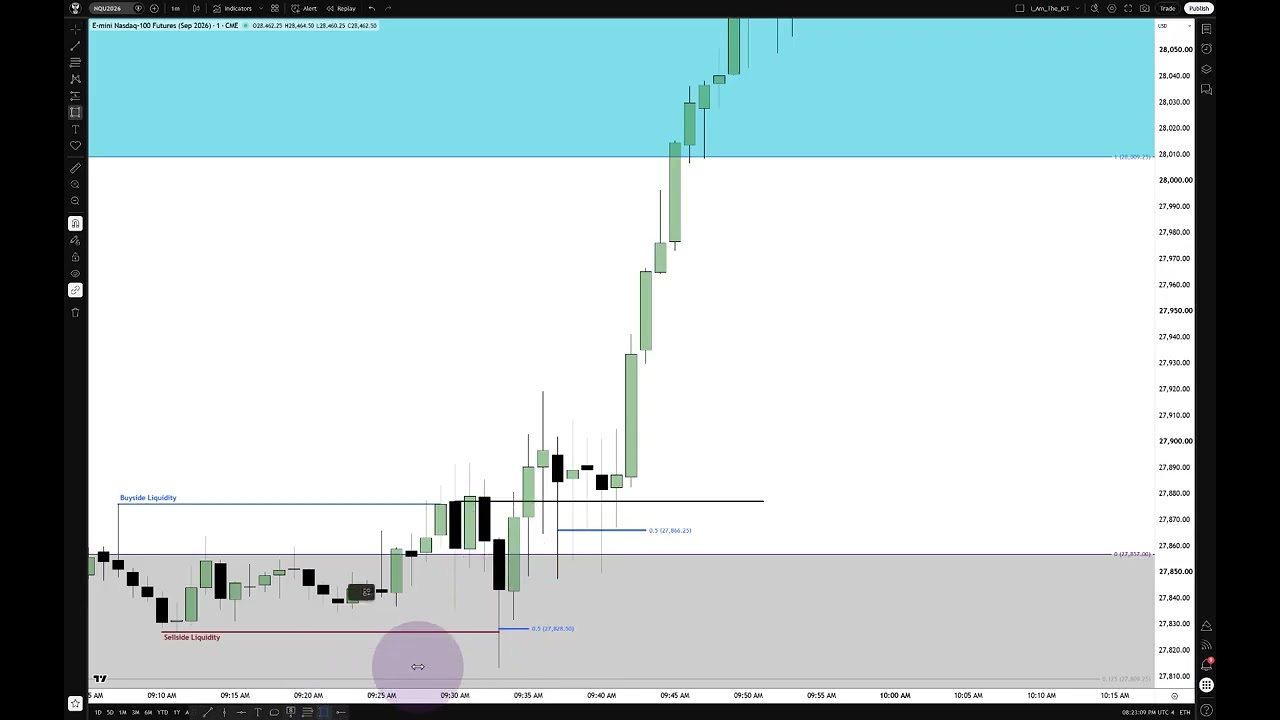
    – Intraday (1‑minute): the move formed a market‑maker buy model — probes lower to collect sell‑side liquidity, prints a wick/reversal and then reaccumulates, which led to a rally toward the planned target.
    – Trade execution: the author entered aggressively below the wick midpoint with 3 contracts, planned to scale into partials (including around the 9:30 RTH open), and saw the price reach the intended levels but could not fully manage the position.
    – Personal interruption: he had to leave due to a family medical emergency (sister‑in‑law with pregnancy complications), so he recorded the whole session and later uploaded an unedited, real‑time video.
    – Teaching points and follow up: emphasizes studying full real‑time footage (not just sped‑up clips) to learn market‑maker buy/sell models, fair‑value gaps, reaccumulation, etc. Promises further demonstration later in the day.

  • Chain Of Custody Of Price With RTH ORG

    Chain Of Custody Of Price With RTH ORG

    https://www.youtube.com/watch?v=V5crdCw0AsY

    Summary:

    The speaker explains the “chain of custody for price”—how price moves between high-probability PD (price discovery) arrays—by using visual, mathematical tools rather than retail myths (support/resistance, generic supply/demand). Core concepts:

    – Markets are algorithmic and autonomous; short disruptions happen, but price delivery follows structural imbalances.
    – Identify and grade inefficiencies (buy-side imbalances, sell-side inefficiencies, suspension blocks) on higher timeframes (daily/weekly). Grading creates octant/quadrant/gradient levels to guide lower-timeframe analysis.
    – Use the regular trading hours opening-range gap (OR gap) as a precise intraday reference (anchor Fib to the higher of the 9:30 candlestick open/close and use the prior session’s final print for the low). Map octant/quadrant levels inside that graded gap.
    – Spot fair value gaps (FVGs): the three-candle pattern where candle two creates the gap. Note first-utilization FVGs (direction of original use) and inversion FVGs (when price later trades through and reverses their logic).
    – A breakaway gap (inefficiency around the midpoint of your analysis that never trades back into) signals strong continuation in that direction.
    – Trade higher-probability setups where time, price, your directional bias, and multiple PD arrays/graded levels agree—more overlapping signals mean a greater likelihood price moves as expected.

    Bottom line: grade inefficiencies, align timeframes and OR gap octant/quadrant levels, watch FVG behavior and overlaps of PD arrays; when multiple tools agree, you get higher-probability price movement.

  • Chain Of Custody Of Price With Daily Inefficiencies

    Chain Of Custody Of Price With Daily Inefficiencies

    https://www.youtube.com/watch?v=XKjdVwBUs2E

    Quick review of Monday’s move and how I traded it: I explained to a student on a trader roundup/X space that price would likely rally into a daily-volume imbalance (which lined up with Friday’s new-day opening gap) and then sell off — and that’s what happened. I use the daily chart anchored to the May 5, 2026 candlestick (its buy-side efficiency and volume imbalances) to project octant/quadrant gradient levels down into lower timeframes (1-minute) for entries, stops and partial exits. Price traded up into the identified imbalance, reversed, and produced several good shorting opportunities; bodies holding outside octants signaled bearish continuation. I got stopped out on a size, reentered, and took partials at the gradient levels — the point being you won’t capture every tick, so trim profits and manage risk. When price spends a lot of time between octants/quadrants, sit on the sidelines and avoid chasing. Volatility is high right now, so expect inconsistency; don’t get discouraged, blame the market, or adopt a toxic mindset — focus on discipline, level-based trading, and accepting “good enough.”

  • ICT Chain Of Custody Of Price

    ICT Chain Of Custody Of Price

    https://www.youtube.com/watch?v=dYQSUCSbYn8

    – This lecture reviews the instructor’s price‑action method applied to the Nasdaq September 2026 mini contract, emphasizing clarity on why recent moves happened and how to anticipate them using his proprietary PD (price‑dissection) arrays.

    – Core concepts: grade and track specific PD arrays (sell‑side imbalances / buy‑side inefficiencies a.k.a. SIBIs, fair value gaps, consequent encroachment / midpoints, volume imbalances, suspension blocks). These form a repeatable “chain of custody” that guides where price is likely to go.

    – Practical rules stressed repeatedly: use candle bodies (not wicks) to define ranges; treat upper/lower halves of inefficiencies as premium/discount — bodies in the lower half indicate bearishness (and vice versa); midpoint (consequent encroachment) and half points are key targets and rejection zones.

    – Multi‑timeframe workflow: collect and carry daily PD levels down into lower timeframes (down to 1‑minute) and use opening‑range gaps, extended fair value gaps, and octant/ quadrant grading to locate high‑probability entries, stops, and targets.

    – Week’s example: he annotated how clustered PD arrays and a daily purple volume imbalance acted as liquidity draws; price respected midpoints, formed measuring/inversion fair value gaps at expected places, and delivered the bearish range he anticipated. He showed a live trade, partial miss and later recovery, to illustrate execution and management.

    – Teaching points: this is advanced material that requires backtesting, note‑taking and repetition. Beginners will find it hard initially but will benefit from learning in volatile conditions. He warns against sloppy anchoring to arbitrary highs/lows or trendlines.

    – Differentiator: he claims his rules are unique, teachable, and reproducible if students use his exact PD arrays and grading process rather than generic support/resistance methods.

    – Next steps: he’ll stop giving advance levels next week to force students to practice grading PD arrays themselves; he will provide daily hindsight reviews so students can learn to recognize the patterns and build skill through repetition and backtesting.

  • Nasdaq Futures Trade Review & Commentary – July 22, 2026

    Nasdaq Futures Trade Review & Commentary – July 22, 2026

    https://www.youtube.com/watch?v=2H_qpeIp2rY

    Summary:

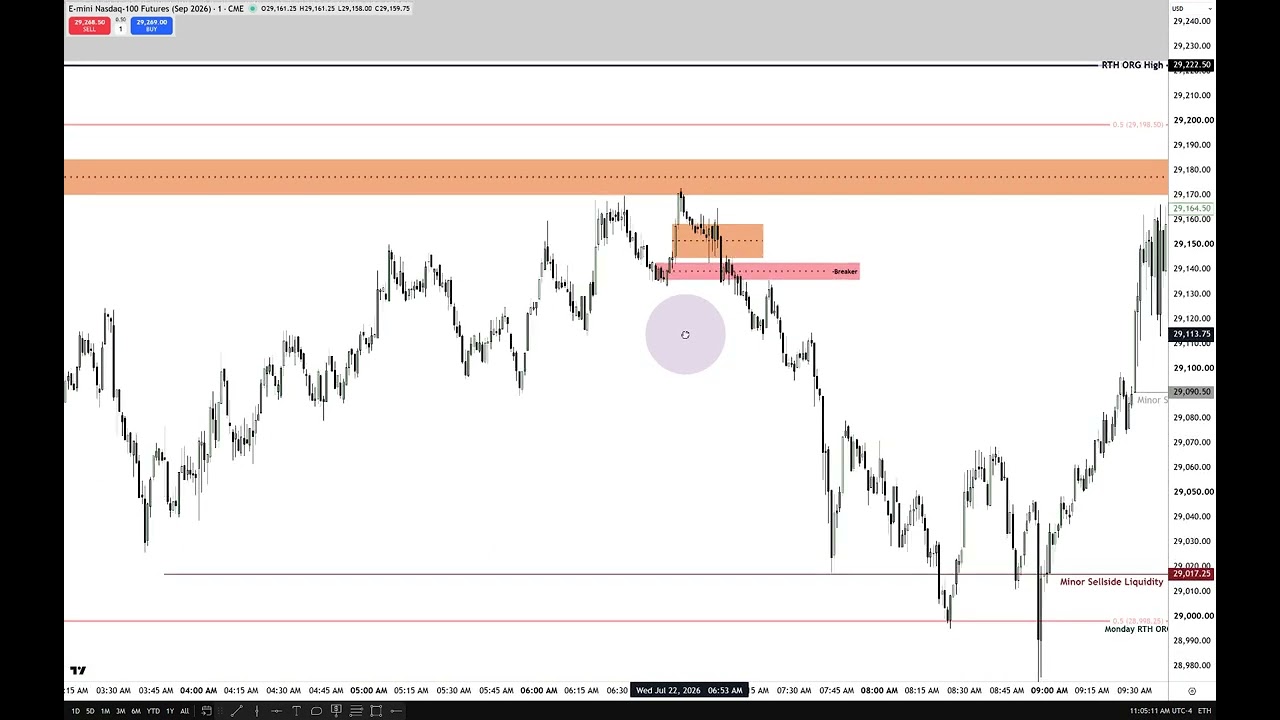
    The speaker reviews recent NASDAQ action using their order-flow framework (buy/sell imbalances, fair value gaps, PD arrays). Overnight price hovered above Wednesday’s 1-hour buy-side imbalance, then opened down into Monday’s regular-hours opening-range gap and rallied into yesterday’s fair value gap before 10:00 (a ~100-handle run). During electronic hours the market failed to sustain a bullish first-utilization gap, inverted into a fair value gap, and rolled lower into Tuesday’s first-presented fair value gap—where the speaker entered a short. They rode the decline to Monday’s opening-range consequent-encroachment midpoint, scaled partial profits at predefined levels, saw a retracement, then another sell-off and a later rally into the 60-minute buy-side imbalance/high octant before the close.

    Key themes:
    – Use of first-utilization vs. first-presentation and inversion of fair value gaps to read bias.
    – Failure of a premium PD array to be tradable was taken as a strong bearish signal.
    – Specific execution: short taken into Tuesday’s fair value gap, partials taken at split levels toward Monday’s encroachment midpoint.
    – Commentary on teaching consistency, social-media posting delays, and community skepticism.
    – Plans to update before the next open if possible; signs off with well wishes for trading.

  • Reviewing High Resistance Liquidity Run Conditions – July 21, 2026

    Reviewing High Resistance Liquidity Run Conditions – July 21, 2026

    https://www.youtube.com/watch?v=e6XwTK4hVqI

    Summary:

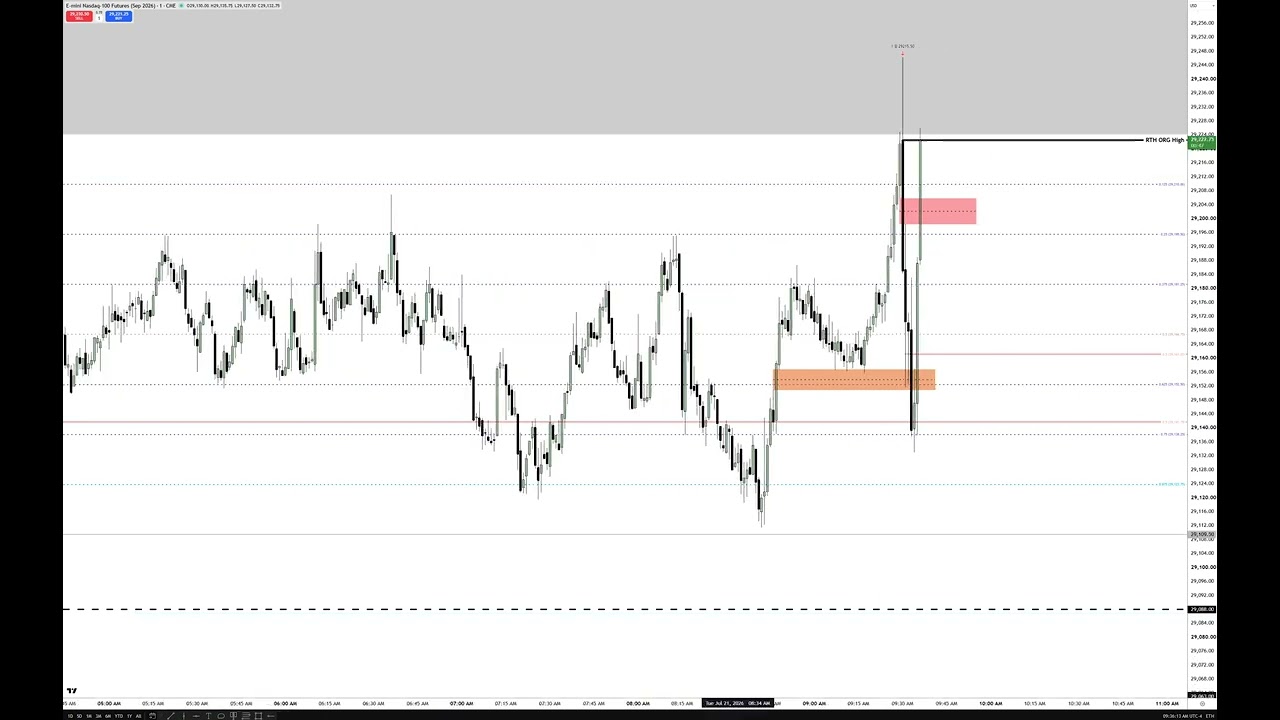
    – Review of a short-term NASDAQ trading session (1-minute chart) focused on Sept 2026 delivery, with emphasis on a large gap up from prior settlement (~450 handles).
    – Core rule taught to Caleb: use the opening-range gap bias for the first hour—if the gap is sufficiently large (20–40+ handles), bias toward the midpoint/half-gap (short on gap-up, long on gap-down). If the gap is small, don’t trade.
    – Decision framework is simple: pick a bias, wait for price to interact with key hourly reference levels (swing lows, “buy-side efficiency” from the hourly chart) and relative equal highs/lows, then execute with defined stops and partial exits.
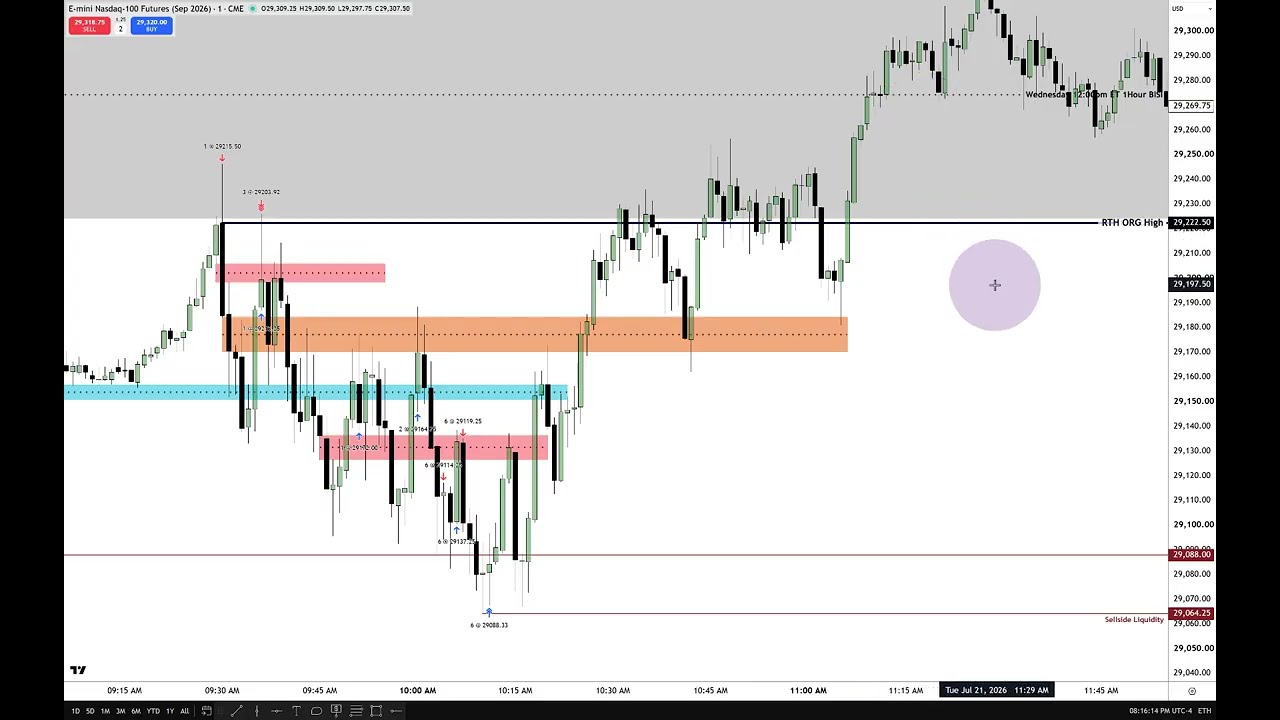
    – Trade recap: initiated shorts into resistance, got stopped, re-entered, took partial profits, later stopped out again—overall a difficult, choppy session but managed drawdown by scaling and exits.
    – Observations: price formed an inversion fair-value gap and failed to reach the half-gap; market was indecisive and traded around hourly reference levels without clear follow-through—advice: often best to sit out during such conditions.
    – Near-term view: could revisit today’s opening range gap overnight or continue higher; geopolitical news could change setup, so stay cautious and watch the opening-range and hourly reference levels tomorrow.

  • Trading In High Resistance Liquidity Run Conditions – July 21, 2026

    Trading In High Resistance Liquidity Run Conditions – July 21, 2026

    https://www.youtube.com/watch?v=tp0qkiWCctw

    Summary:

    – Trader livestream reviewing a volatile intraday session. Yesterday’s price hit his pre-market objectives; today opened with a large opening-range gap and quickly became choppy and manipulated.
    – He described his trading plan and actions: sold one contract based on a 60-minute “buy-out-of-balance”/sell-side efficiency, targeted relative equal lows and the half-gap, took partials, got stopped out, re-entered, and ultimately captured some of the move but endured whipsaws.
    – Key technical concepts emphasized: opening-range gap and half-gap as magnets, sell-side efficiency/inversion fair-value gaps, relative equal highs/lows, liquidity pools, and the distinction between bodies (confirm breakdown) vs wicks (failed break).
    – Recurrent market behavior: “high-resistance liquidity run” conditions — lots of price sharing in a tight range, quick runs to obvious stops, repeated retracements and stop-hunting (he personified the mover as “Phil”).
    – Risk and trade management lessons: keep position size small in volatile/high-resistance markets, move stops and take partials to manage psychology, don’t try to force entries when price is highly manipulated, and use morning-session bias (9:30–11:00) and gap structure as a simple framework.
    – Teaching note: these are hard conditions for students/new traders; better to demo/paper trade or sit out until price shows low-resistance (clear, stretched) moves.