
Tag: ictyoutube

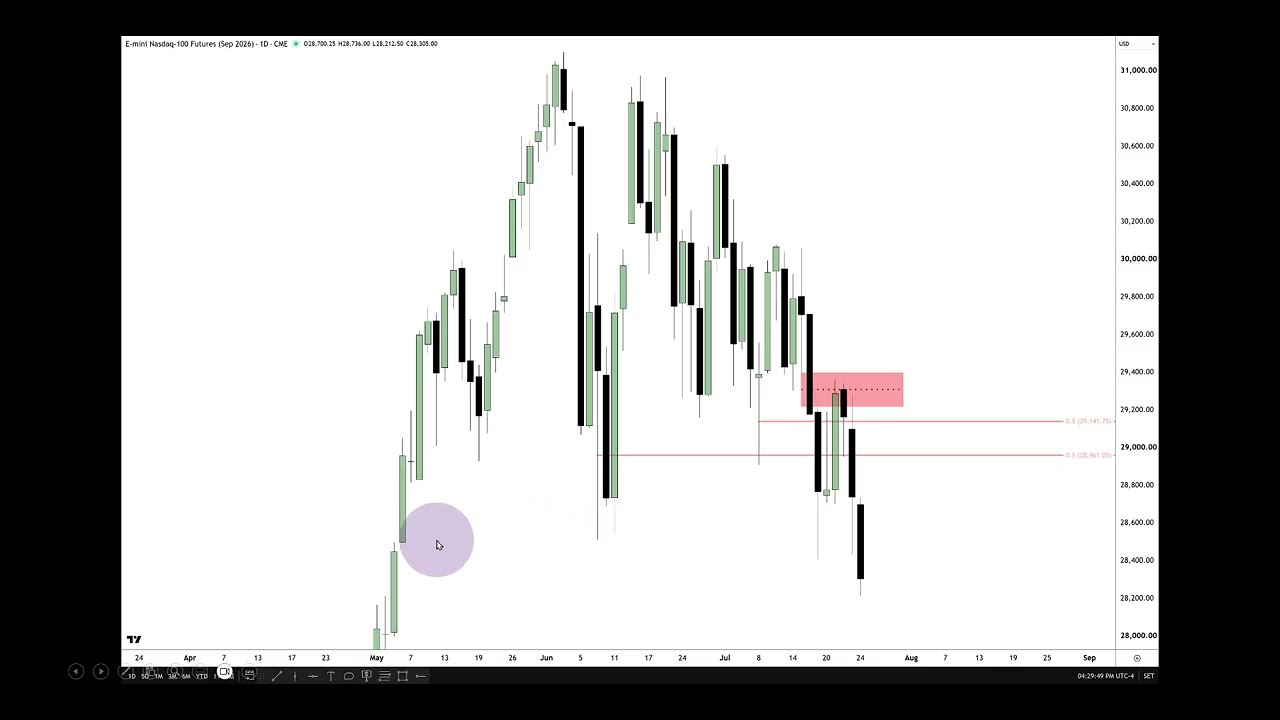
  • NQ Futures Review & Commentary \ May 27, 2026

    NQ Futures Review & Commentary \ May 27, 2026

    https://www.youtube.com/watch?v=qf5qokimwO4

    Here’s a concise summary of the livestream:

    – Focus: Review of the NASDAQ/ES daily charts and a live intraday example showing how the speaker reads price action to identify short opportunities even inside a primary bull market.
    – Instruments & accounts: Recommends micro contracts for small or inexperienced accounts (and for prop-firm trading) to reduce risk and size.

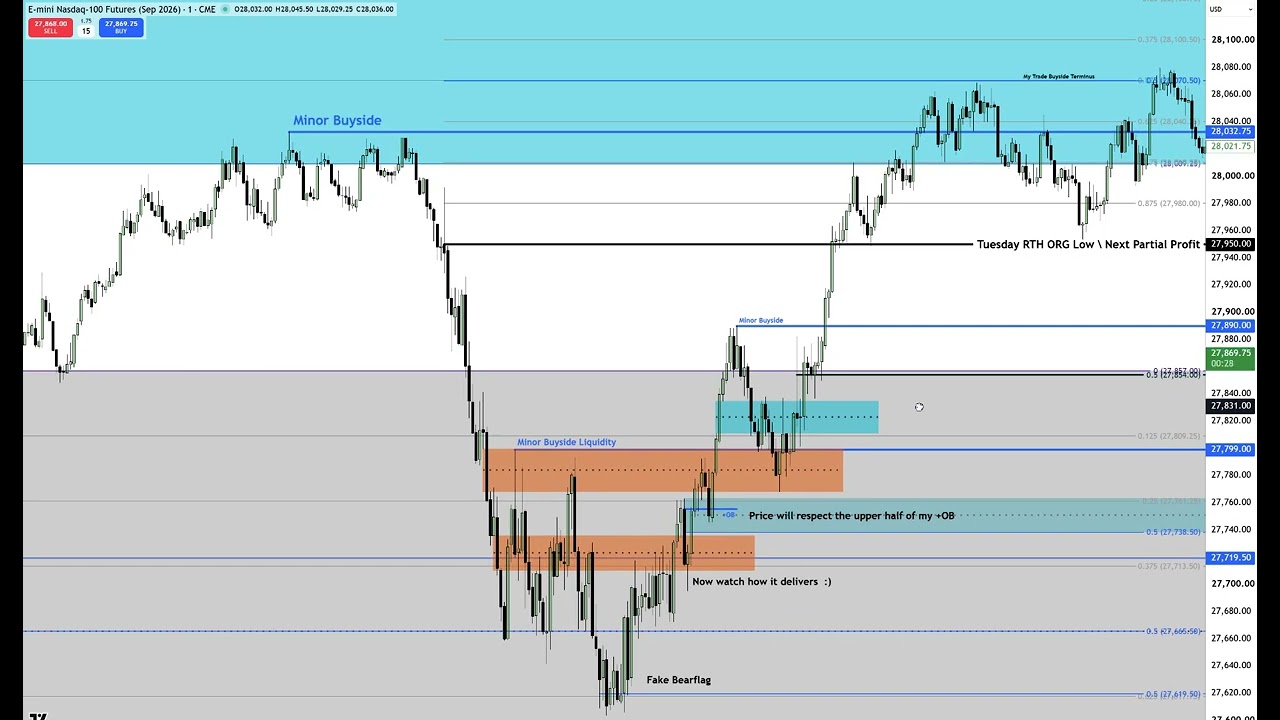
    – Market context: Predicted a post‑May rally after taking out relative highs, then identified a specific daily volume‑imbalance area that would act as a magnet for price and a likely place for a short‑term reversal.

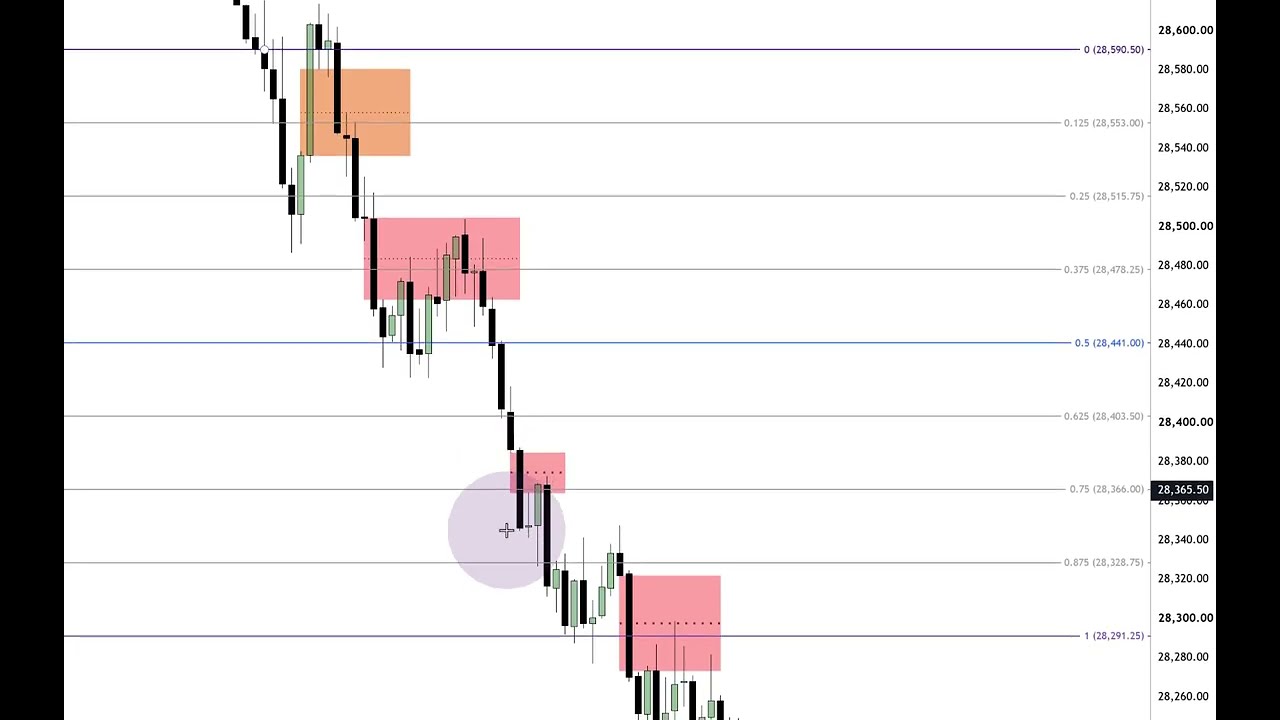
    – Key technical concepts taught: read the open/high/low/close, spot volume imbalances, fair‑value gaps (and inversion FVGs), “consequent encroachment” and inefficiencies after blowoff runs, and use measured moves/standard‑deviation projections to set targets.

    – Trade rules and mindset: prefer short setups that show quick, one‑direction fills of inefficiencies; use fulcrum/measure moves and -2 SD projections for precision; accept being stopped if overleveraged is avoided; novices (<~1–2 years) should favor longs in a bull market.

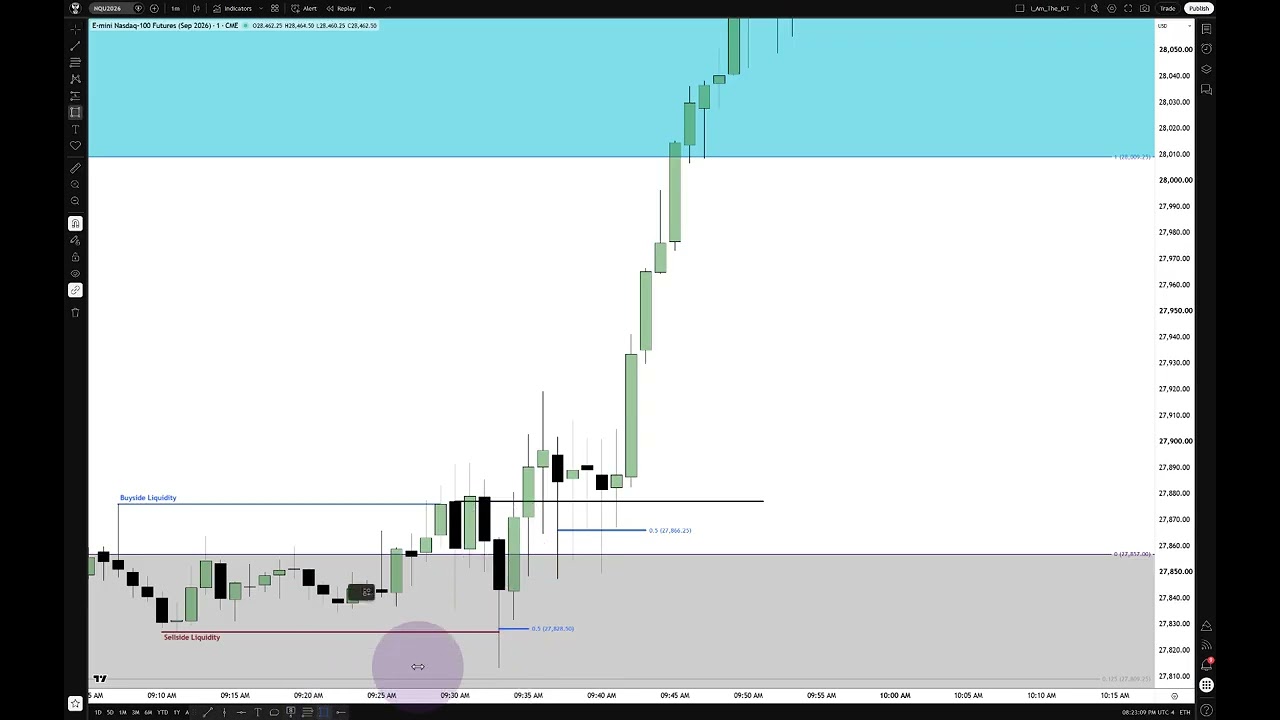
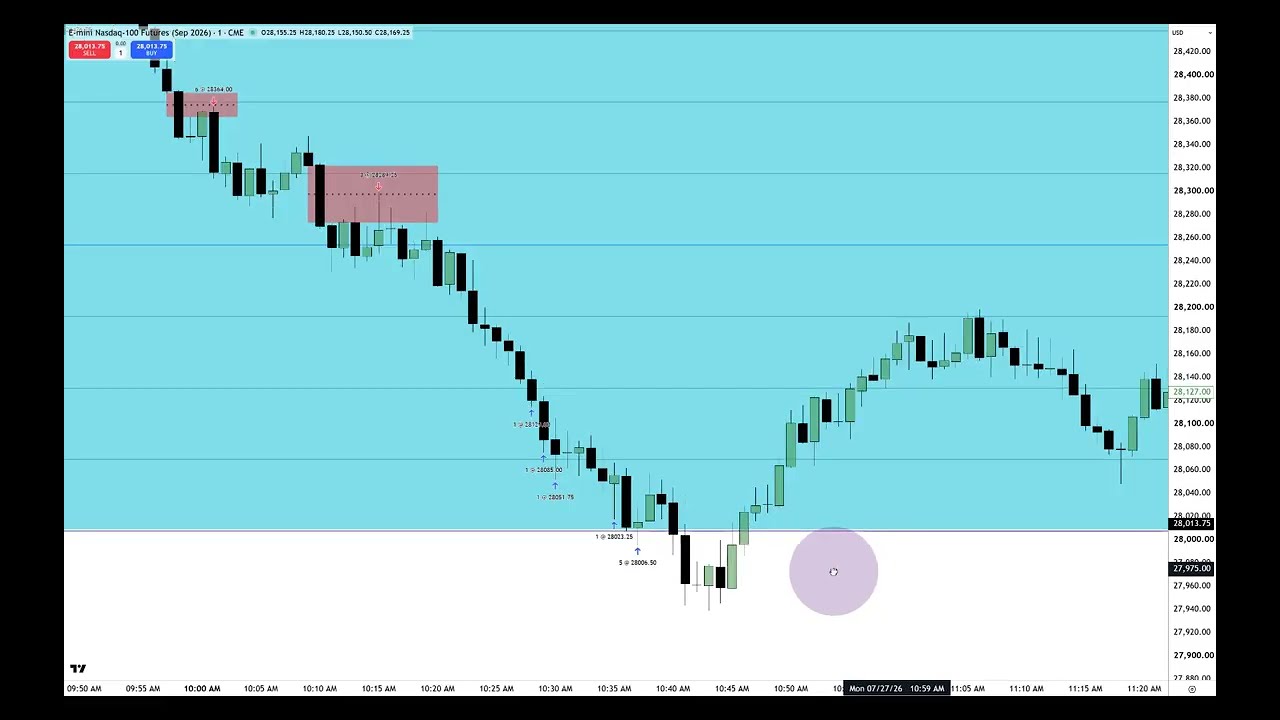
    – Execution example: identified an intraday fair‑value gap and volume imbalance, entered a short around the open with a built‑in buffer, saw a clean drop to the target but missed some of the larger move—used the experience as intel.

    – Warnings and advice: don’t rely on “gimmicks” or paid holy‑grail claims; develop price‑reading language/discipline; keep capital and living expenses in reserve (two years, ~$100k suggested) before trading full‑time.

    – Operational note: will reduce public real‑time detail in future live trading to avoid influencing other traders’ orders; continues to teach concepts and critique poor mentorships.

    Main takeaway: focus on clean price‑action reading (open/high/low/close, volume imbalances, fair‑value gaps), manage risk and position size, gain experience before aggressively shorting into a bull market, and use measured projections to plan entries and targets.

  • Oil Review & General Commentary

    Oil Review & General Commentary

    https://www.youtube.com/watch?v=dwMgP2zkH0w

    – Market backdrop: Prices are largely driven by geopolitical news (U.S./Israel/Iran) — stay cautious and avoid chasing volatile instruments.
    – Recent price action: After a gap down, the author expected further weakness and described a quick, profitable short based on 15‑minute and 1‑minute patterns (relative equal lows, an inversion/fill of a volume/price imbalance). Stop was placed above the swing high.
    – Dollar/FX: The dollar (DXY) is stuck in a range, so USD-based major forex pairs are quiet; non‑USD (exotic or cross) pairs show more movement.
    – Metals: Gold and silver have shown capitulation-like behavior after big rallies. ICT advised taking profits earlier and is currently sidelined on metals, not bullish on silver.
    – Crypto: Bitcoin failed to push past the 127k area, then sold off. Key supports to watch are the mid/high‑tens of thousands (noted ~49.7k) and then the ~24–26k area; downside risk remains.
    – Trading stance: The author is being cautious, practicing on demo for indices (ES/NQ) and not trading live due to fickle market conditions.
    – Takeaway: Be selective, follow price structure and risk management, and avoid markets the author has flagged to “leave alone.”

  • Tapereading \ Practice Session Final Hour ES

    Tapereading \ Practice Session Final Hour ES

    https://www.youtube.com/watch?v=7zlblhLGraA

    Summary:

    Michael describes taking a long trade with a stop loss just below a recent low, targeting the last hour’s relative equal highs (around 3,400–3,450). They watch for accumulation, footholds, fair value gap inversions and order-blocks as entry/validation points, then raise stops to reduce risk as price confirms. The session is slow and “spotty” early, but a run of big green candles and algorithmic buying in the 3:15–3:45 macro window drives a clean rip higher. The trader criticizes sloppy use of “macro” by others, notes this was tradable though not ideal, and ultimately clears positions after the highs are taken out.

  • Market Alchemy – Trading ATH \ May 14, 2026

    Market Alchemy – Trading ATH \ May 14, 2026

    https://www.youtube.com/watch?v=wprXVW1pW9Y

    – Time comes before price. Anchor your charts to New York local time and use vertical time lines—time windows strongly govern predictable market behavior.
    – Key times to watch:
    – Market open / opening price at 9:30 ET (opening range gap).
    – New York “lunch macro” 11:30–13:30 ET (optimal setups usually form in the first hour, 11:30–12:30).
    – PM opening range around 13:30–14:00 ET (use this for the late session and evening sessions).
    – Opening range gap: the gap between the prior close and the opening price is a useful reference. It often fills, acts as discount/premium arrays, and can become a trampoline for continuation in the direction of the higher timeframe.
    – Combine time with price projections: measure the opening-range gap and use Fibonacci/standard-deviation multipliers (he refers to roughly 6.5–7.5 “SD” levels empirically) to project targets. Use these projections in the specific time windows (especially the lunch macro) for higher-probability signals.
    – Liquidity mechanics: expect stop-hunts and liquidity runs (micro spikes that are later “redelivered”). Markets often move to clean out liquidity (everyone’s stop losses) before reversing.
    – Trade selection & risk management:
    – Be highly selective shorting at all-time highs; inexperienced traders should avoid aggressive shorts against a strong higher-timeframe trend.
    – Use limit orders placed around known wicks/relative equal lows/highs for exits; take partial profits and be mindful of one-tick overruns.
    – If market is sloppy or choppy, don’t trade—wait for clearer setups (e.g., next morning pre-market).
    – Markets behave algorithmically and repeat patterns at specific times—studying the time+price relationships repeatedly builds the necessary edge.
    – Practical advice: practice, study the time-based methods, and be patient—experience is required to execute these techniques reliably.

    Bottom line: prioritize time structure (NY time windows), measure opening-range gap projections, expect liquidity grabs, manage risk carefully (especially when trading against the higher-timeframe trend), and practice consistently to internalize these repeatable patterns.

  • Turning Loss Into Gain – Market Alchemy

    Turning Loss Into Gain – Market Alchemy

    https://www.youtube.com/watch?v=d8du4fMvOQU

    – Context & setup: The speaker walks through a live trade using an inversion/fair-value-gap as a long entry, targeting the 8:30-news candlestick high. The plan is to buy in the lower half of the gap, wait for a candlestick close inside/above key levels, and push price toward the buy-side liquidity zones.

    – Technical rules emphasized: watch candlestick bodies (preferably staying in the upper half of the gap), respect wick/correction closes (a close above the corrective wick is confirmation), and prefer a fast, low‑candle-count rip (speaker wanted <7 candles to first partial).

    – Risk & position management: use stops below the relevant candlestick low, scale into/out of the position (take partials at meaningful highs), move stops to reduce risk, and keep a small residual position if necessary rather than over‑leveraging.

    – Market behavior: describes frequent stop-hunts, manual intervention/“manipulation,” and baiting of retail shorts. These conditions require more active management and patience compared with clean, low-resistance liquidity runs.

    – Psychology & process: accept losses as part of trading; don’t fear stops; avoid revenge trading or overtrading after a stop; follow rules and a consistent model. Experience desensitizes the trader to market “jump scares.”

    – Teaching philosophy: there are no shortcuts—learning comes from watching price and practicing. The speaker rejects flashy marketing and emphasizes practical experience, journaling, and developing one’s own approach rather than copying others.

    – Practical takeaway: trade the plan, manage risk proactively (partials and stop moves), monitor each new candlestick to see if it still supports the thesis, and prioritize consistent process and experience over chasing perfect trades.

  • ICT 2026 Futures Review & RTH ORG Commentary \ April 29, 2026

    ICT 2026 Futures Review & RTH ORG Commentary \ April 29, 2026

    https://www.youtube.com/watch?v=tbEzAhdv_Ak

    – Context and protocol: Today is an FOMC day — trade by 10:30 ET (first hour) and then step to the sidelines until the Fed’s statement and press conference. Be neutral/no bias heading into the announcement; expect choppy, manipulated, or lethargic price action.

    – CFD vs futures / legality: The presenter uses CFD feeds (US100, US500) for demos but paper-trades them because U.S. citizens can’t legally trade some CFD brokers. Price/time alignment between CFD candles and futures is the key when transposing levels. He does not endorse brokers or affiliate deals.

    – Recap of yesterday’s execution: He demonstrated a short on MNQ based on a large opening-range gap down, targeting lower-quadrant/octant levels and portions of last week’s range (30% → 20%). Trade rationale relied on market-maker sell-model signatures: opening-range gap, inversion/fair-value gaps, consequent encroachment, and relative equal lows.

    – Technical framework emphasized: opening-range gaps (RTH), octants/quadrants, inversion/fair-value gaps, order blocks, buy/sell-side inefficiencies, and relative equal highs/lows as liquidity targets. He uses time-aligned candles to map levels between feeds.

    – Practical live observations: This morning’s action was slow and balanced with minor buy- and sell-side inefficiencies. He described what would confirm a bullish run (body above specific midlines) versus signs that a lower sweep was likely (bodies staying in lower halves, closing below key lows).

    – Execution mechanics note: He avoids market-replay for live execution demonstrations because replay changes on-screen execution markers; highlighted that small differences in candle formation/timing matter when mapping levels.

    – Trading mindset and pedagogy: Tape-reading is a discipline—make it routine, calm, and process-oriented (meditative rather than adrenaline-driven). Trust a repeatable model, accept uncertainty, practice indifference to outcomes, keep a journal, and focus on risk management and execution rather than chasing profits or emotional wins.

    – Final practical advice: On FOMC days, limit live trades, observe and learn, and only engage when your model gives clear, high-probability setups. Experience and repetition build pattern recognition and emotional control; maturity is accepting that not every session will produce a perfect outcome.

  • ICT 2026 Trading MNQ Futures & CFD US100 \ April 28, 2026

    ICT 2026 Trading MNQ Futures & CFD US100 \ April 28, 2026

    https://www.youtube.com/watch?v=jz0RbL1oVK8

    Summary:

    – ICT is executing a short trade in the micro NASDAQ (MNQ) and mirroring it on a US 100 CFD, adjusting stops and targets to the relative equal lows from that morning.
    – He highlights price discrepancies between real-time MNQ futures and the CFD feed but emphasizes that the same liquidity-based entry logic (lower quadrant 75, opening-range/gap levels, order blocks) can be transposed between futures and CFDs.
    – Key technical concepts used: opening-range gap, inversion/fair-value gaps, bullish/bearish order blocks, “gray pool” (sell-side liquidity pool between two wicks), event horizon (midpoint between lows), and body/wick placement as confirmation.
    – Trade management: stop placed above recent highs, partial profit-taking planned at an “event horizon” level, and a time stop rule if price fails to show directional conviction within a few candles.
    – He annotates the CFD chart heavily for students who can’t access futures markets, demonstrating that CFD price action can validly reflect the same order-flow signals (while noting legal/regional restrictions on CFD trading).
    – Emphasizes not endorsing any broker shown (Capital.com appears on his chart but he has no affiliate relationship).
    – The trade is executed and managed live (demo for CFDs due to US legal limits), partials are taken, and execution confirmations appear in the corner—used to teach that the method works across instruments when managed properly.
    – Overall point: the order-flow/liquidity approach and execution rules used for MNQ futures can be applied to CFDs; careful stop management, candle-body rules, and liquidity targets drive entries, confirmations, and exits.

    Quiz

    1) What instrument did ICT say he was shorting at the start of the session?
    A. S&P 500 futures
    B. Micro NASDAQ (MNQ)
    C. US 100 CFD only
    D. EUR/USD

    2) Why did ICT compare MNQ futures price versus the CFD price?
    A. To promote Capital.com as a broker
    B. To show CFDs are illegal everywhere
    C. To compare and contrast real-time price action and show they may differ but map similarly
    D. To prove market replay is necessary

    3) Which specific entry mechanism level did ICT mention using?
    A. Upper quadrant 50 level
    B. Lower quadrant 75 level
    C. VWAP pivot level
    D. Opening range high

    4) What name did ICT give to the two-wick liquidity area he annotated?
    A. Event horizon
    B. Minor sellside pool
    C. ICT gray pool
    D. Inversion fair value gap

    5) What trade management action did ICT describe after the move progressed?
    A. Closed the entire position immediately
    B. Doubled the position size
    C. Took partial profits (e.g., “take three off”, “take two off”)
    D. Moved stop to break-even and added a new leg

    Answer key with evidence (no timestamps available):

    1) B. Micro NASDAQ (MNQ)
    Evidence: “All right. So, we’re going to be doing some work here in the CFD. So, I’m going short here in the micro NASDAQ.” and later references to “MNQ” throughout.

    2) C. To compare and contrast real-time price action and show they may differ but map similarly
    Evidence: “Notice that the prices do not agree, but we’re comparing and contrasting real-time price action with MNQ futures price versus the CFD um price…” and “I’m comparing and contrasting what I would do if I was doing the futures contract only versus what I see in the CFD market.”

    3) B. Lower quadrant 75 level
    Evidence: “the entry mechanism which is the lower quadrant 75 level”

    4) C. ICT gray pool
    Evidence: “There’s a gray pool forming. … Now, in between those two consequent encroachments, that is the ICT gray pool.”

    5) C. Took partial profits (e.g., “take three off”, “take two off”)
    Evidence: “Take three off. That’s good. … And we’ll take two off here in the MNQ and we’ll market that.” and “I’m probably going to take something off.”

  • ICT 2026 Low Probability Tape-reading \ April 21, 2026

    ICT 2026 Low Probability Tape-reading \ April 21, 2026

    https://www.youtube.com/watch?v=5PpnT-l-zSk

    Summary:

    – Market context: Fed Chair testimony at 10:00 (and headlines) creates low-probability conditions for precise intraday trading. The speaker is watching MNQ (micro E-mini Nasdaq) after a 9:30 open that ran up then dropped.

    – Key technical focus: watching fair value gaps (FVGs), especially an inversion FVG and Monday’s regular trading hours (RTH) settlement/opening-range gap low (previous day 4:14 pm ET). Preference is for lower prices (short bias) with a target area near 26,695, but he acknowledges the Fed could push price higher and he won’t force participation.

    – Execution notes: he was building a short between two FVGs and adding as price validated “premium sensitivity” (bodies concentrated in the lower half of a gap). He emphasizes bodies (real liquidity) over wicks, first-utilization validation of FVGs, and how inversion vs. bearish FVGs function.

    – Practical rules taught:
    – Use FVGs that show clear first-utilization (they prove themselves).
    – If a gap acts as bearish on first use, trading above it can turn it into an inversion FVG (and vice versa).
    – Order-block entry rule (candlestick selection): if the last candle in a series is the largest (or the smallest) use its open; if candles are uniform use the first (lowest) candle’s open.

    – Risk/discipline points: he trades in a demo account to avoid offering regulated trade advice (not a licensed advisor), and to protect both him and viewers. He warns against copying posted levels as trade signals; instead build and test your own price-action model, and only trade when the market gives context.

    – Teaching/operational notes: livestream and posting problems this morning; intends to work on entries in future lessons; time will be more limited due to family/grandparent responsibilities.

    – Final advice: today is a study day—observe price action, journal objectively, don’t let social media/critics dictate trades, and only engage when your model and price action align.

  • ICT 2026 Futures Market Review \ April 21, 2026

    ICT 2026 Futures Market Review \ April 21, 2026

    https://www.youtube.com/watch?v=PCMv3J6_9Lg

    – Context: ICT ran a live stream covering a busy morning (Fed comments, Trump, Middle East news) and urges viewers to watch the live replay first because it shows his real‑time reasoning and price action before outcomes unfold.

    – Market view and result: After 10–11 consecutive up days, he expected a retracement and went bearish on NQ, targeting 26,695. He explained why (daily wick midpoint, cleared buy‑side liquidity, gap structure) and that target was reached when price dug into prior opening‑range gaps.

    – Methods and concepts used: He emphasized simple, repeatable tools — regular trading‑hours opening‑range gaps, fair value gaps (PD arrays), buy/sell imbalances, first‑utilization and inversion, and engineered liquidity — rather than complex indicators or DOM tools. He demonstrated entries, partials, and how levels flip utility when traded through.

    – Charting and workflow advice: Annotate key levels and journal them (he keeps levels in a notepad), keep charts tidy (use separate workspaces for overlapping ranges), study annotated charts to build anticipatory tape‑reading skills, then practice viewing charts “naked.” Use paper/demo trading to learn before risking real money.

    – Broader market notes: He reviewed MES, S&P and Dow structure, expects more retracement potential, and warned about algorithmic activity and liquidity engineering that can bait stops.

    – Logistics and tone: He plans premarket/commentary and a live tape‑reading session tomorrow through 10:10 ET. He stressed the value of live real‑time teaching, pushed back on critics, and encouraged learners to keep showing up to build skill.

  • ICT 2026 Lecture:  Trading ATH In The ICT PD Array Matrix \ April 20, 2026

    ICT 2026 Lecture: Trading ATH In The ICT PD Array Matrix \ April 20, 2026

    https://www.youtube.com/watch?v=r-ztz7kReYc

    – Topic: trading all-time highs using the ICT PD-array matrix (example: MNQ micro Nasdaq futures).
    – Key setup: toggle the continuous contract (not the front-month) to bring price into a usable context; identify the most relevant prior high/wick near current price.
    – Primary levels used:
    – October 30, 2025 premium wick → consequent-encroachment (midpoint) as a major reference.
    – TGIF (20% of the weekly range) as a target area for retracement.
    – Friday RTH opening-range gap midpoint (settlement at 4:14pm) as a key intraday level.
    – Price-structure rules: premium vs discount wicks, inversion fair-value gaps (FVGs), and sell-side liquidity pools are used to define entries (shorts in this case). “First presented” FVG and consequent-encroachment are priority entry zones.
    – Timeframes: drop to 1-minute / sub-minute charts to confirm willingness (or lack thereof) to reclaim midpoints and to spot short-term sell-side imbalances.
    – Execution notes: the presenter executed shorts into inversion FVGs, took partials, and missed some additional move due to being away / technical issues; explained why he chose to scale out and not re-enter.
    – Risk approach: uses defensive PD-array / “bolo” levels as reliable stop anchors but will not disclose detailed stop-management mechanics.
    – Market context: heightened manipulation, geopolitical/news noise (e.g., Strait of Hormuz tweets) makes trading more difficult and increases need for caution and confirmation.
    – Practical advice: practice entry drills to overcome fear, journal observations, and use relative strength across correlated indices (NQ vs ES vs YM) to pick which average to trade.

    Bottom line: toggle continuous contract, find the closest high/wick and its midpoint, combine weekly TGIF and RTH-gap midpoints with inversion FVGs on lower timeframes, and trade entries only when price structure shows no willingness to reclaim those midpoints — all while accounting for increased market noise.