
Tag: innercircletrader

  • ICT Price Action Chronicles – MOC Crushing The Buying & Selling Pressure Myth

    ICT Price Action Chronicles – MOC Crushing The Buying & Selling Pressure Myth

    https://www.youtube.com/watch?v=HFWqQelvrJw

    Summary:

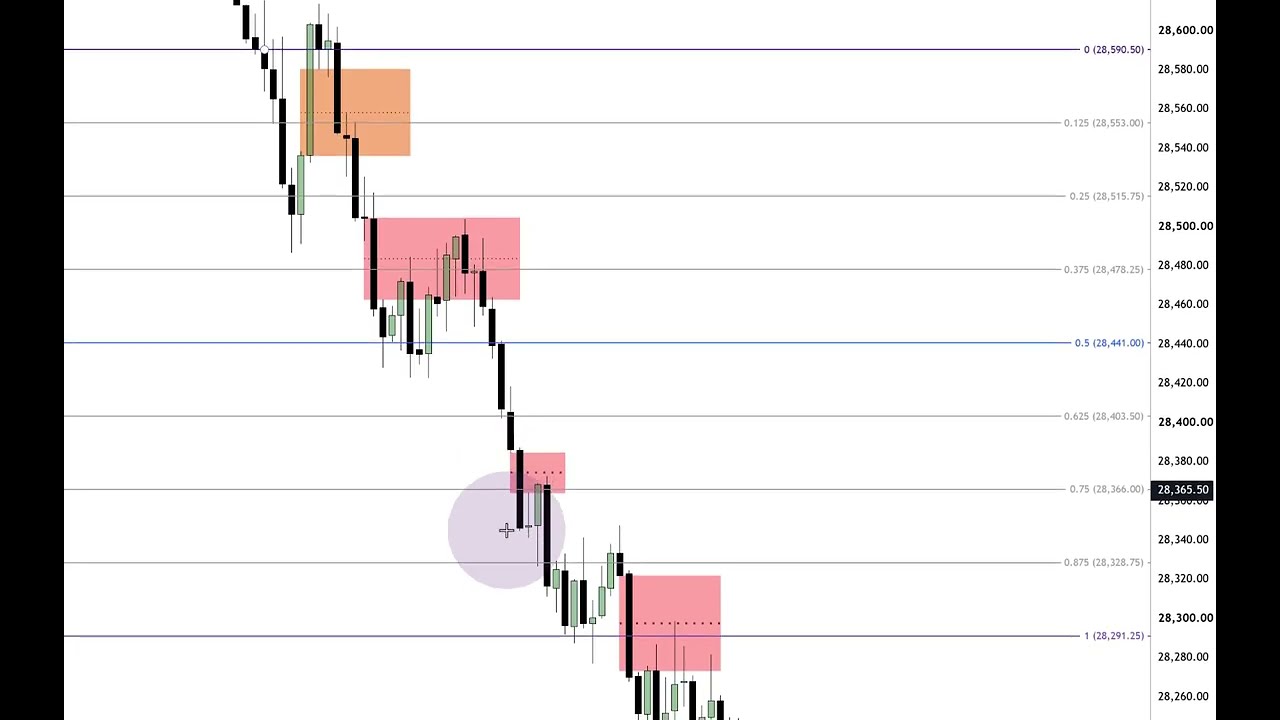
    The speaker reviews an E-mini S&P Market‑on‑Close trade (Aug 4, 2026), using the prior day’s lecture as context and focusing on precise, repeatable price‑action methods rather than broad indicators. Key ideas:

    – Focus window: measure the full daily range (intraday high to low) and concentrate on the final hour (3:00–4:00 PM ET) and PM‑session structure (pre‑market 1:30–2:00 PM, then 3:50–4:00 PM) to find high‑probability, short-duration setups.
    – Tools and signals: use simple price‑action tools — measured range, anchored fibs (including negative .5), octant/16th splits, candlestick structure, fair value gaps, and volume imbalances — to calculate exact price levels and bias.
    – Trade logic: wait for price to rally into defined highs (liquidity pools/inefficiencies), then look for failure (rejection, fair‑value gap inversion, close below key levels) to enter a short; use partials and tight stops. Candlestick behavior and order‑flow rules validate direction.
    – Execution nuance: setups are surgical and time‑sensitive; small imperfections and manual intervention can occur. The instructor shows live execution but warns that publicizing exact stops/targets attracts other traders’ orders, which can undermine an edge.
    – Teaching stance and risk: the presenter will not provide live trade calls or one‑on‑one mentorship and stresses operator responsibility — students must practice, learn the process, and accept personal risk. The methods are presented as systematic, mathematical, and repeatable but require experience to use reliably.

  • ICT Price Action Chronicles – Market On Close Macro

    ICT Price Action Chronicles – Market On Close Macro

    https://www.youtube.com/watch?v=PP1-i0ti_tQ

    This is a trading lesson using the August 3, 2026 New York PM session to teach a short, repeatable intraday “market-on-close” (aka “murder on close”) scalping macro that often produces clean, predictable price runs in the last hour of regular trading. Key timing rules: set your clock to New York local time; the NY PM pre-session begins at 1:30 PM ET, 3:00 PM often produces a defining premium wick (PDA) and 3:50–4:00 PM is the critical 10-minute market-on-close window to watch. Method highlights: identify the last-hour high/low range, grade any wicks (wicks take precedence over adjacent fair-value gaps), spot relative equal highs/lows and minor sell-side/buy-side liquidity pools, then project the first-octant/0.5 fib level as a high-probability target (example target shown ~28,870.75). Risk and execution: anchor stop-losses near the 3:00 premium-wick high (upper-half context), allow measured drawdown into the wick, add to positions on expected tests, and use partials rather than obsessing over perfect exits. Trade psychology and process: expect losses and missed trades, backtest the rules, practice disciplined entries/management, and refine execution over time rather than chasing perfection.

  • Part 2 High Precision Secrets To Intraday Price Action

    Part 2 High Precision Secrets To Intraday Price Action

    https://www.youtube.com/watch?v=BD7kqmgdBU8

    Summary:

    – The speaker (34 years trading) emphasizes studying how markets form highs/lows and session structure by logging, backtesting and learning the underlying mechanics rather than relying on pundits or simplified “systems.”
    – Primary framework: use the daily chart as the source for high/low/range information, then grade that range by time (opening range, first hour, PD arrays, octants/quadrants) and price (fair value gaps, order blocks, volume imbalances).
    – Practical setup explained in detail: measure the opening range gap (e.g., 9:30 open vs prior settlement at 4:14), identify consequent encroachment (half-gap), fair value/inversion gaps, and PD arrays to predict likely reactions and targets.
    – Trade rules and money management: prefer low-hanging objectives first (half-gap), take partials (e.g., partial at half-gap, bulk at full gap closure), leave a runner, pyramid into drawdown if able, place stops above consequential levels, and use micro contracts if volatility makes larger stops impractical.
    – Targets and extensions: plan exits at half-gap, full gap, negative0.2, negative0.5, and 1.0 standard deviation levels; roll stops up as trades progress to protect profits.
    – Philosophy: this is a technical, time-and-price science — not pattern superstition. It requires disciplined study and cannot be meaningfully shortcuted; laziness produces weak, short-lived results.
    – Personal notes: he’s confident in his method, will be reducing his teaching pace over the next two years, supports a charity via partner prop firms, and encourages serious students to study deeply to gain precision and confidence.

    Takeaway: Learn to measure and grade daily ranges, identify key price/time levels (opening range, fair value gaps, PD arrays), trade conservatively with staged profit-taking and stop management, and commit to disciplined journaling and backtesting rather than quick shortcut systems.

  • Part 1 \ High Precision Secrets To Intraday Price Action

    Part 1 \ High Precision Secrets To Intraday Price Action

    https://www.youtube.com/watch?v=DRTvbkKmuAw

    – Opening remarks and brief apology for a distracted recording; personal anecdote about family and a live-stream discussion.
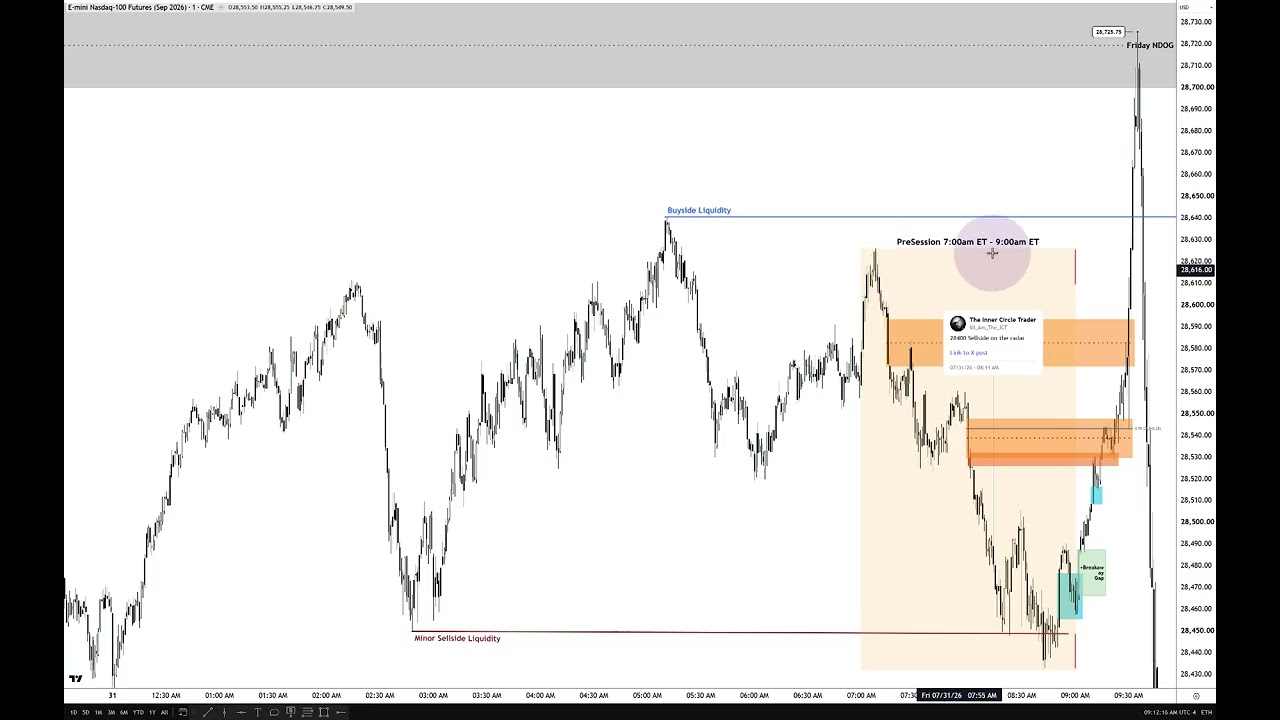
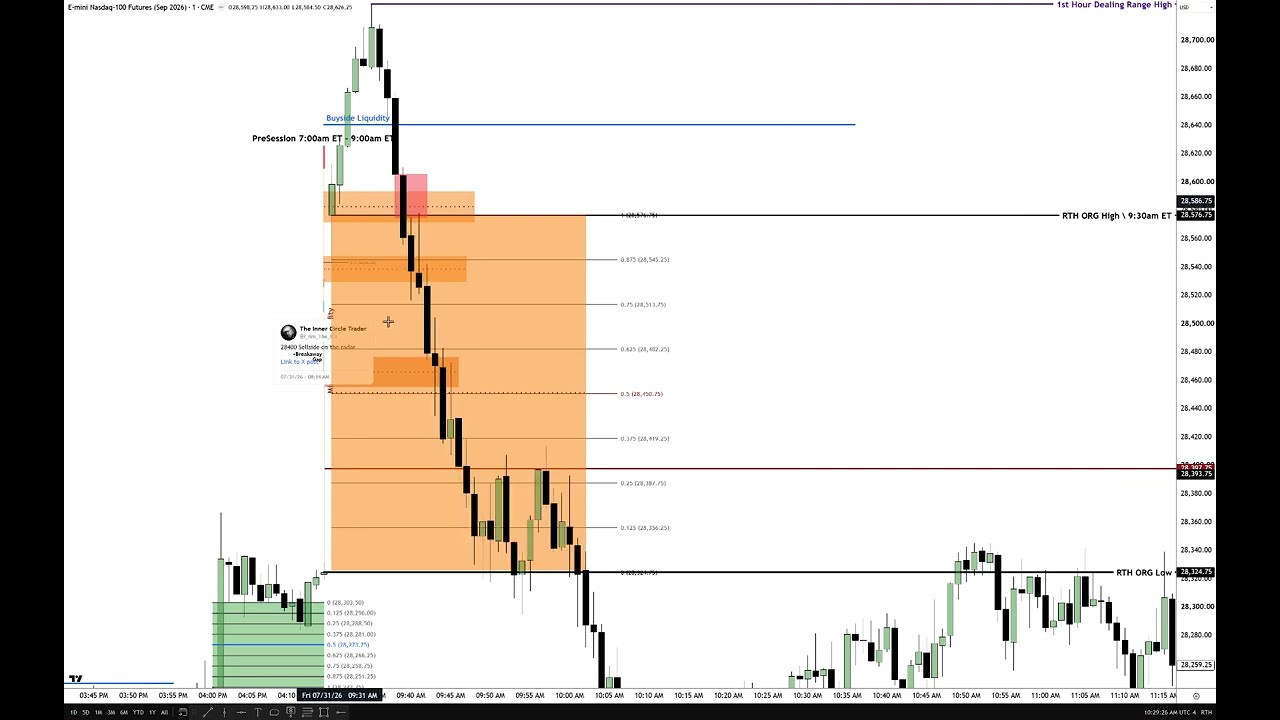
    – Core trading idea: focus on a specific, finite pre-market time range (pre-session 7:00–9:00 a.m. ET). Treat that window as the primary data sample for the regular session.
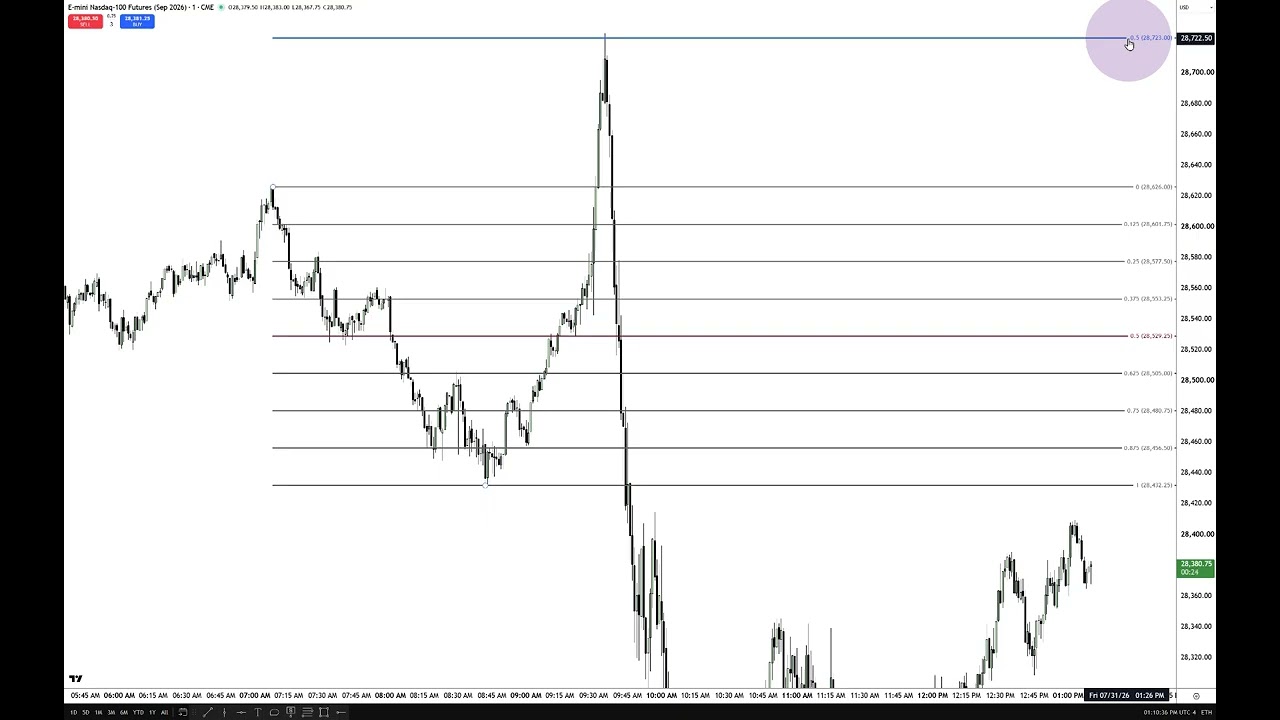
    – Methodology: anchor a Fibonacci to the highest high and lowest low inside the 7–9 a.m. range, then project precise horizontal price levels (quadrants/octants, midpoints) forward as key reference points.
    – Key price-structure concepts used: buy-side imbalances / sell-side inefficiencies, inversion fair value gaps, breakaway gaps, consequent encroachment — all tethered to specific candles and the time-based range.
    – Practical rule: levels must be precise and time-anchored (not vague “zones”); trades are anticipatory (based on those specific levels and the 9:01+ behavior), not reactive.
    – Example: he publicly identified and shorted the daily high in a recent session, targeted ~28,400, and the market reached the projected area—used to demonstrate the method’s predictive value.
    – Broader approach: use the last 3 days for intraday low/high projections; combine daily and intraday references (wicks, opening gaps) to refine targets.
    – Teaching philosophy and criticism: urges students to study and verify (not blindly trust), defends against trolls/copycats, and stresses the mental effort and discipline required to master the method.
    – Summary takeaway: a time-anchored, level-specific framework (pre-market 7–9 a.m. + precise technical constructs) yields high-probability, anticipatory trade setups when applied consistently.

  • Market Review NQ July 31, 2026

    Market Review NQ July 31, 2026

    https://www.youtube.com/watch?v=uws9egBxPLI

    – Instructor opened with a short review and logistics (may post more content on YouTube; translations can be limited if videos exceed an hour).
    – Market recap: price rallied into last week’s Friday volume imbalance, then after FOMC retraced into the same imbalance; weekly low held and price followed through to near the week’s start.
    – Teaching focus: a methodology combining market structure, time-and-price grids (PD arrays, octants/quadrants), and strict criteria for using fair value gaps/inefficiencies and volume imbalances — not just visual guesses.
    – Key tactical framework: use the pre-market “dealing range” (7:00–9:00 ET) and the opening range (9:30–10:30 ET) to build time-based horizontal levels; project range extensions (notably the 0.5 fib) to forecast likely session highs/lows.
    – Examples given: specific levels (e.g., 28,400) and how buy-side imbalances / sell-side inefficiencies aligned with octants and algorithmic times (8:30, 8:50–9:10) to produce predictable reactions.
    – Execution tips: enter small “information” contracts to read order flow (even 1-second candles), use demos or micros to test, and scale into trades when price confirms.
    – Emphasis on experience: the system requires practice; the teacher criticizes shortcuts, rebranding by others, and says experience cannot be simply transferred.
    – Personal anecdote: he traded the setup (shorted near the projected high, hit target around 28,400), describing trade management lessons and minor execution errors.

  • ICT Algorithmic Time & Price Grids

    ICT Algorithmic Time & Price Grids

    https://www.youtube.com/watch?v=4SJlJdIANCo

    Summary:

    – He reviews the NASDAQ September futures move: an aggressive sell-off at open followed by a fast, efficient rally into a daily-level target, driven by intraday order flow and algorithmic programs.
    – Key technical framework: daily “suspension blocks” (shaded blue/gray), octants/quadrants, PD arrays, order blocks, fair value gaps (FVGs) and “buy/sell efficiency” cells. These layered levels anchor where price will turn or continue.
    – Important price-action rules he uses: bodies staying in the upper half of a candle = bullish; wicks probing but not closing below midpoints = accumulation; stop-hunts clear retail stops before directional moves; measuring wicks and candle midpoints predicts strength/ failure.
    – Time structure matters: he applies a horizontal/vertical time-price grid (macro start times, top-of-hour/macro closes like 10:50 and 11:10) to anticipate where turns and PDAs will form.
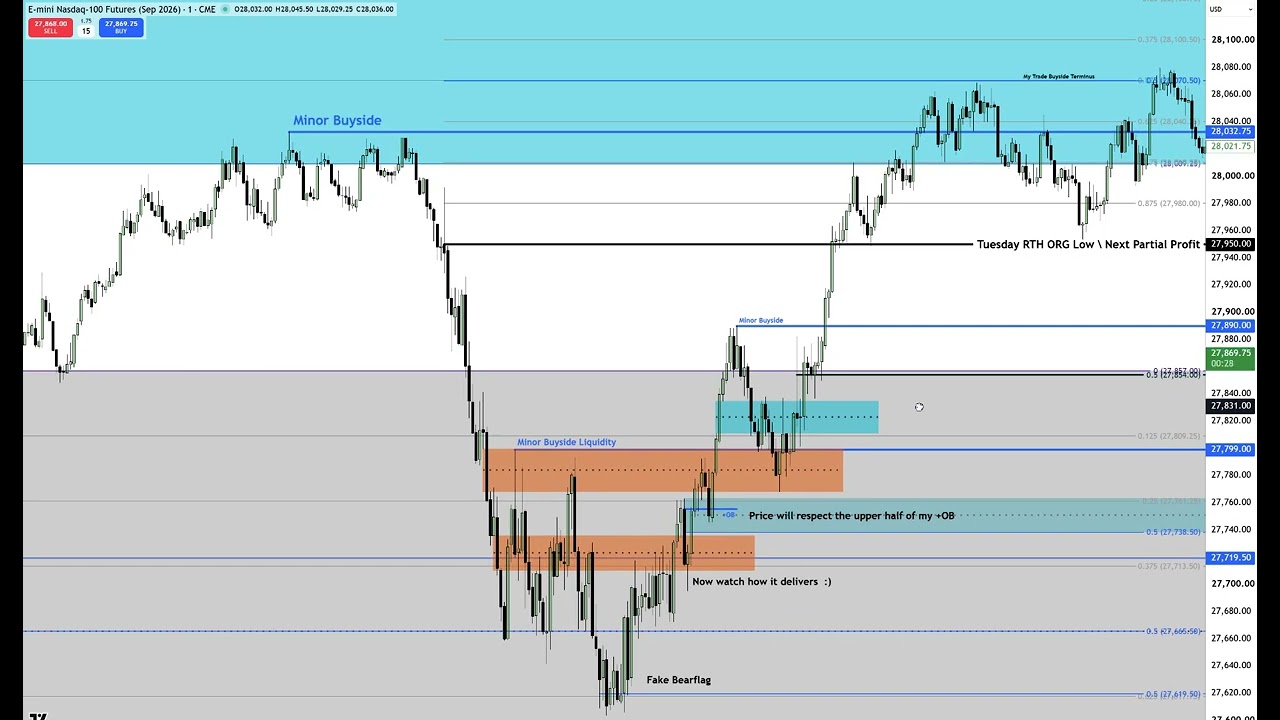
    – Examples from the session: opening above short-term highs, stop-hunt to take out stops, accumulation in an order block anchored to a daily octant, then a rapid buy program that produced big moves into the daily suspension-block high; later formation of inversion FVGs and retracements that validated his rules.
    – Methodology emphasis: predict from repeating algorithmic signatures rather than react; learn the specific language/criteria he teaches, backtest, then tape-read live; one PDA at a time before mastering others.
    – Critique of common alternatives: he rejects generic “supply/demand” or momentum-chasing approaches and market randomness claims, arguing markets are algorithmic and can be read with precise rules.
    – Teaching philosophy: encourages discipline, independent thought, patient practice, and money management. The goal is to internalize his methods so students can trade independently.

    Bottom line: he argues the day’s action confirmed his layered price/time framework and rules for reading order flow, and he stresses learning that language and discipline to predict rather than react.

  • Predicting Session Low & High With Executions

    Predicting Session Low & High With Executions

    https://www.youtube.com/watch?v=J9G1j3-e1GU

    Summary — key points

    – Daily chart: price reached the author’s downside objective and created a bullish order block / deep-discount suspension block with an inefficiency. That zone (around 27,665.5) is a likely bounce area; even if price keeps falling, it’s a good hunt for a low-risk buy.
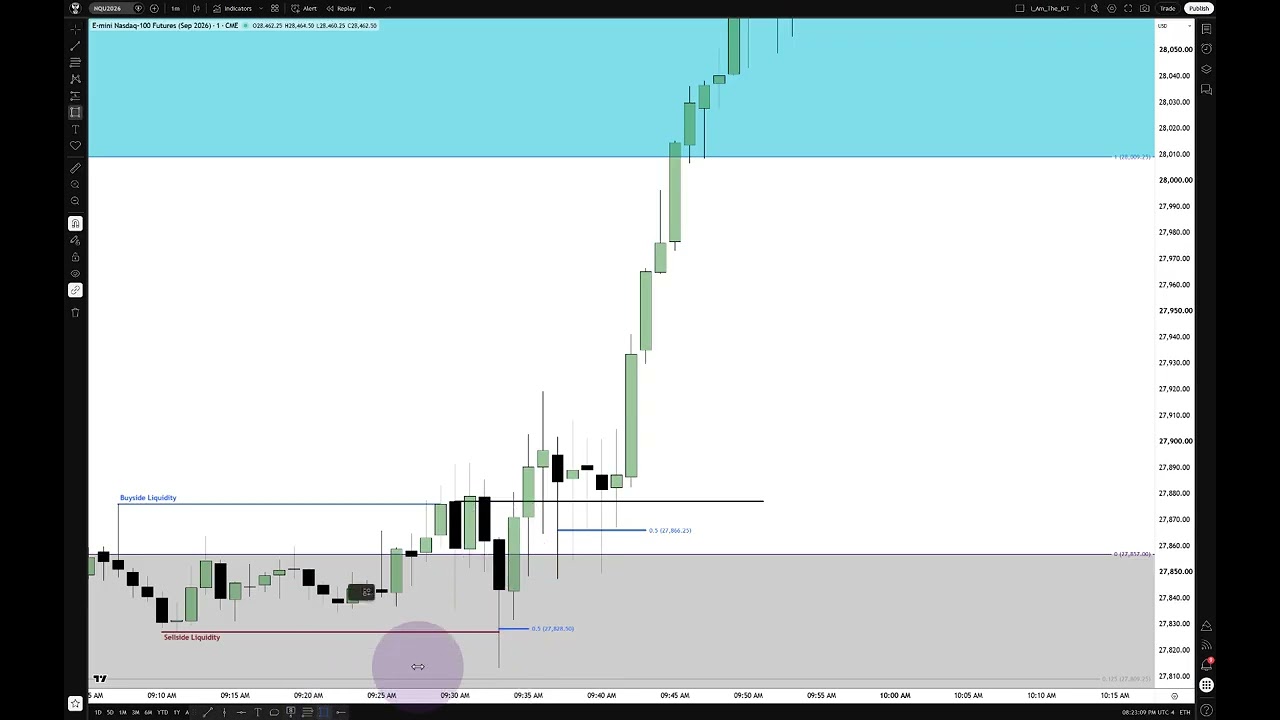
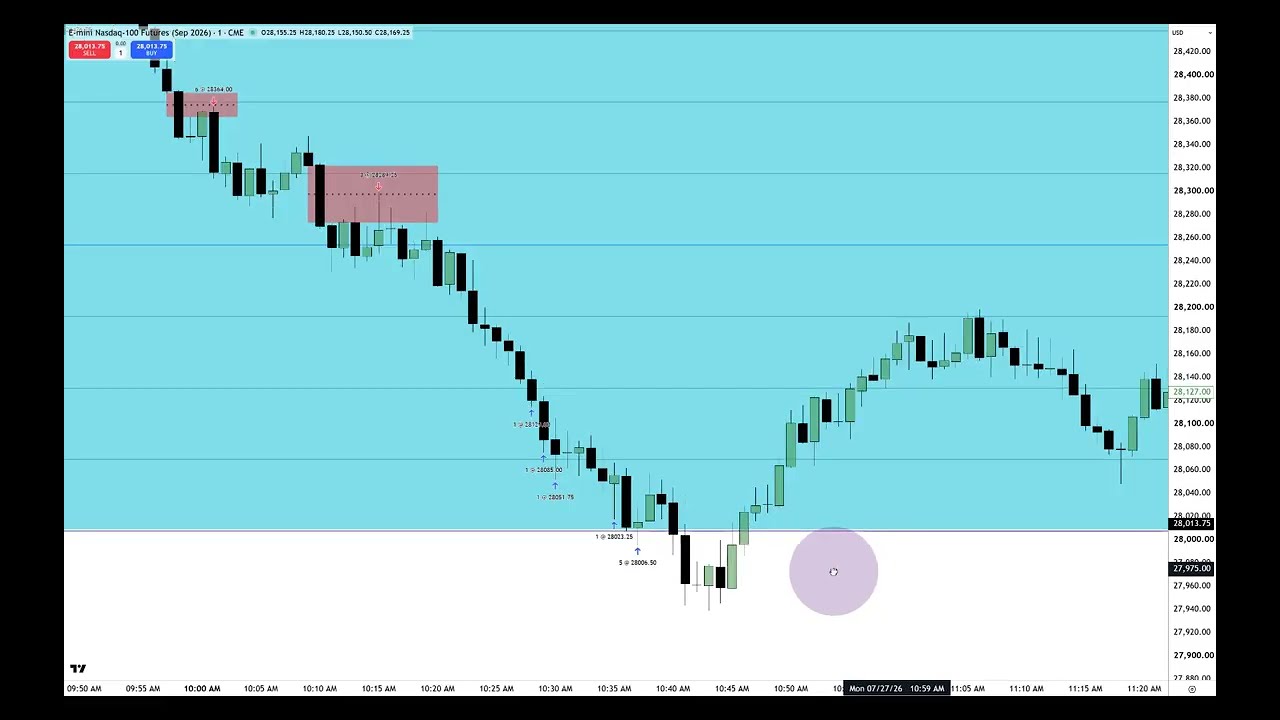
    – Intraday (1‑minute): the move formed a market‑maker buy model — probes lower to collect sell‑side liquidity, prints a wick/reversal and then reaccumulates, which led to a rally toward the planned target.
    – Trade execution: the author entered aggressively below the wick midpoint with 3 contracts, planned to scale into partials (including around the 9:30 RTH open), and saw the price reach the intended levels but could not fully manage the position.
    – Personal interruption: he had to leave due to a family medical emergency (sister‑in‑law with pregnancy complications), so he recorded the whole session and later uploaded an unedited, real‑time video.
    – Teaching points and follow up: emphasizes studying full real‑time footage (not just sped‑up clips) to learn market‑maker buy/sell models, fair‑value gaps, reaccumulation, etc. Promises further demonstration later in the day.

  • Chain Of Custody Of Price With RTH ORG

    Chain Of Custody Of Price With RTH ORG

    https://www.youtube.com/watch?v=V5crdCw0AsY

    Summary:

    The speaker explains the “chain of custody for price”—how price moves between high-probability PD (price discovery) arrays—by using visual, mathematical tools rather than retail myths (support/resistance, generic supply/demand). Core concepts:

    – Markets are algorithmic and autonomous; short disruptions happen, but price delivery follows structural imbalances.
    – Identify and grade inefficiencies (buy-side imbalances, sell-side inefficiencies, suspension blocks) on higher timeframes (daily/weekly). Grading creates octant/quadrant/gradient levels to guide lower-timeframe analysis.
    – Use the regular trading hours opening-range gap (OR gap) as a precise intraday reference (anchor Fib to the higher of the 9:30 candlestick open/close and use the prior session’s final print for the low). Map octant/quadrant levels inside that graded gap.
    – Spot fair value gaps (FVGs): the three-candle pattern where candle two creates the gap. Note first-utilization FVGs (direction of original use) and inversion FVGs (when price later trades through and reverses their logic).
    – A breakaway gap (inefficiency around the midpoint of your analysis that never trades back into) signals strong continuation in that direction.
    – Trade higher-probability setups where time, price, your directional bias, and multiple PD arrays/graded levels agree—more overlapping signals mean a greater likelihood price moves as expected.

    Bottom line: grade inefficiencies, align timeframes and OR gap octant/quadrant levels, watch FVG behavior and overlaps of PD arrays; when multiple tools agree, you get higher-probability price movement.

  • Chain Of Custody Of Price With Daily Inefficiencies

    Chain Of Custody Of Price With Daily Inefficiencies

    https://www.youtube.com/watch?v=XKjdVwBUs2E

    Quick review of Monday’s move and how I traded it: I explained to a student on a trader roundup/X space that price would likely rally into a daily-volume imbalance (which lined up with Friday’s new-day opening gap) and then sell off — and that’s what happened. I use the daily chart anchored to the May 5, 2026 candlestick (its buy-side efficiency and volume imbalances) to project octant/quadrant gradient levels down into lower timeframes (1-minute) for entries, stops and partial exits. Price traded up into the identified imbalance, reversed, and produced several good shorting opportunities; bodies holding outside octants signaled bearish continuation. I got stopped out on a size, reentered, and took partials at the gradient levels — the point being you won’t capture every tick, so trim profits and manage risk. When price spends a lot of time between octants/quadrants, sit on the sidelines and avoid chasing. Volatility is high right now, so expect inconsistency; don’t get discouraged, blame the market, or adopt a toxic mindset — focus on discipline, level-based trading, and accepting “good enough.”

  • TRU Mentorship Sunday – Chain of Custody | July 26, 2026

    Summary — Monday mentorship on “chain of custody” (mapping unrealized dealing ranges)

    Purpose

    • The session explains how to identify, grade and trade unrealized dealing ranges (PD arrays) — i.e., where price is likely to run to and where intra-day PD arrays (order blocks, fair value gaps, breakers, etc.) should form. The method uses time-based session anchors, octants/quadrants on a fib, and PD-array validation to distinguish retracements from reversals.

    Key practical rules and workflows

    • Anchor your intraday canvas to clear, time-based reference points: previous month/week/day highs & lows, last three days’ high/low, and session highs/lows (e.g., midnight ET opening price and 2:00 AM ET for the London window).
    • For London trading specifically (trading 3:00 AM London session; 2:00–5:00 AM ET): use the range from midnight ET open to the low formed before 2:00 AM ET. If a CB/SIBI exists there, anchor your fib to the high of the relevant CB (number-two candle) and draw to the low of that two‑hour range. Grade the range with octants/quadrants and wait for PD arrays to form at those levels.
    • If you trade only London and plan to be done before NY open, aim modest targets (e.g., 25–30 handles on Nasdaq CFD) and accept you won’t capture multi-session daily range.
    • When using new‑day/new‑week opening gaps or registered opening range gaps, require agreement (inefficiencies both above and below price) and use them as additional anchors for grading and stacking PD arrays.

    Order flow & PD-array validation

    • True continuation setups form predictable PD arrays at octant/quadrant levels; if price consistently fails those levels or tears through non‑anchored FVGs/blocks, expect consolidation or a reversal.
    • Practical signals: how candles trade into/around prior candle bodies/wicks, relationships of body-to-wick, and whether fair value gaps remain unfilled or are aggressively taken out — these are the real order-flow clues.
    • Speed and how many PD arrays are invalidated matter: knocking off three PD arrays tends to indicate a reversal; fewer may be a retracement.

    Volume imbalances, suspension blocks & stops

    • When toggling settled/unsettled imbalances, use the more prominent (larger) volume imbalance as your reference — it’s less likely to be invalidated by noise.
    • For a suspension block formed by a 3-bar pattern, identify the three reference PD-array levels (lower imbalance high, midpoint/consequent-encroachment, and the upper imbalance high) to define bias/stops and invalidation points.

    CFD vs futures guidance

    • If you trade CFDs outside the U.S., analyze the equivalent futures contract for cleaner structure and use that for bias; map those levels to your CFD chart at the same candle/time. Expect CFDs to underperform the futures’ ultimate range, so scale targets down (take partial profits earlier).

    Practice advice

    • Spend time backtesting and studying the grading concept across sessions and higher timeframes. Start with the simple rule set (session highs/lows, prev day/week/month, last three days), learn to recognize PD-array formation around octants/quadrants, then build to more complex gap & mitigation flow ideas.
    • The methodology rewards patience and pattern recognition rather than guesswork — grade the canvas and wait for PD arrays to validate the bias.

    Other notes

    • Several live Q&A examples illustrated the rules in real charts (London trading, a Nasdaq CFD question, and a weekly/monthly suspension block sweep), and the tutor stressed using higher timeframes to set bias and the octant/quadrant grading to confirm intraday opportunities. The session included off-topic banter about live trading and community personalities.