
https://www.youtube.com/watch?v=KEqzv2yOAf0
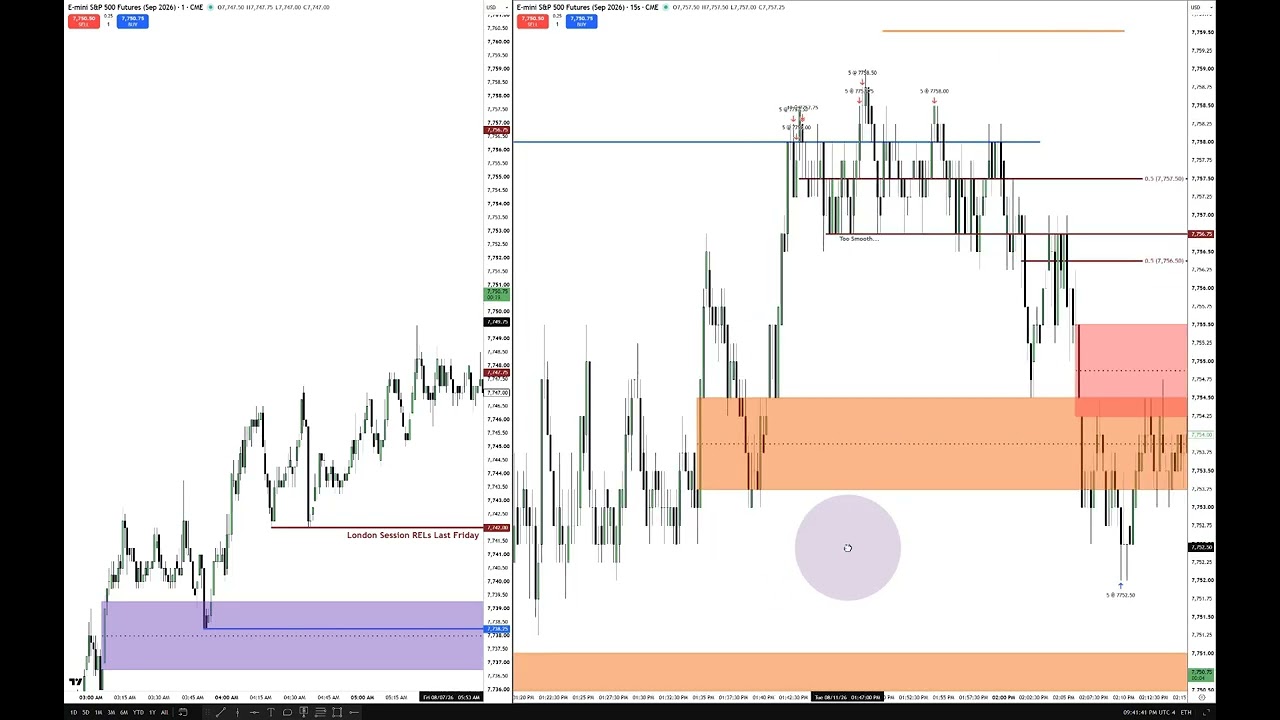
– Context: A quick review of the September‑2026 S&P 500 futures trade shown on a 1‑minute chart and a 15‑second chart (each candle = 15s on the right).
– Key technical levels annotated: last Friday’s London‑session relative equal lows, a suspension block, and a buy‑side liquidity pool. The trader placed limit exit orders just ahead of that relative‑lows level and exited before price reached the suspension block.
– Entry rationale: a short‑term high and a swing‑trader fulcrum/measured‑move setup — the idea that the measured move up should project down. The immediate objective was “low‑hanging fruit” execution just above the relative equal lows.
– Price behavior and execution: the market respected levels very precisely (to the tick). There were inversion fair value gaps (IFVGs), volume imbalances, smooth rollovers, and repeated body/ wick interactions at key prices. The trader took partials at the IFVG and other levels, removed singles as price declined, then re‑entered/remained active as price rotated back.
– Market commentary: S&P is described as a “gentleman’s market” — cleaner and more precise than NASDAQ or the Dow. NASDAQ moves are larger and can reveal cracks in correlations; choice of market should match a trader’s personality.
– Outlook and process: CPI release tomorrow (8:30 ET) — the trader will not speculate. He shared an unedited (sped‑up) execution video for students to study 15‑second candle behavior and price delivery.
– Philosophy and teaching plan: he rejects adopting other people’s methods, argues his approach is superior and broadly applicable across asset classes, and plans to focus his content and teaching on his method over the next two years.
Leave a Reply