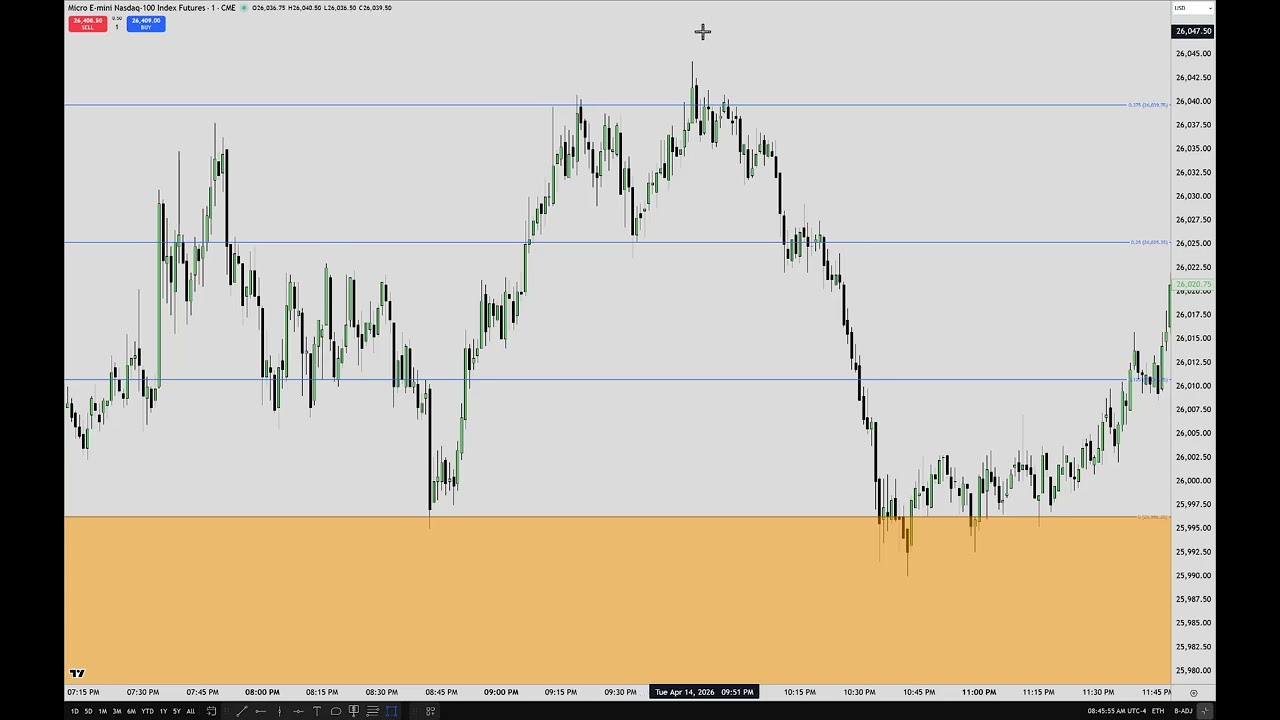
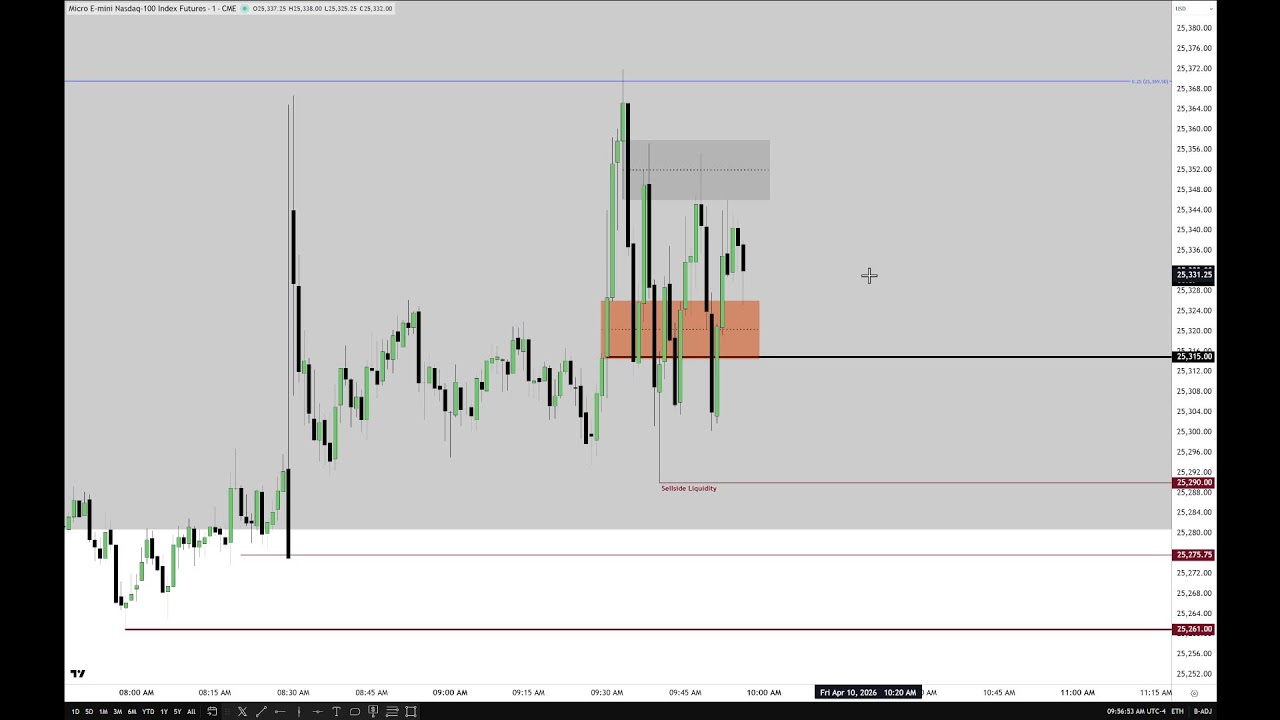
ICT reviews an Asian-session trade they shared on X, explaining the setup, execution, and rationale. Working off a macro window around 9:50–10:10 and using daily as their highest actionable timeframe, they identified a key wick/premium area and an inversion/fair-value gap (FVG) as a higher-timeframe turning point. Dropping to a 1-minute chart they hunted a Turtle-Soup–style entry into two stages of buy-side liquidity, then used a bearish FVG to short into deeper liquidity pools. They recorded the entire trade live (not market replay) and posted it for verification. They scaled out with partials near the swing low and closed the remainder near the targeted liquidity; price later reclaimed the lower FVG and rallied. Main lessons: treat wicks/gaps and FVGs as important levels, combine higher- and lower-timeframe context, and manage entries/exits into liquidity.
– This was a live trading “drill” session meant as practice, not trade advice. The instructor repeatedly warns viewers not to copy these live examples with real money and to use demo/paper accounts for drills.
– Focus and method: working mainly on 1-minute charts with a sub‑1‑minute executable frame (15‑second) to practice entries into fair value gaps (today) and order blocks (upcoming). The aim is to learn how to spot small inefficiencies, liquidity pools, relative equal highs/lows, and consequent encroachment.
– Objective and trade sizing: treat drills like “leg day” — uncomfortable but necessary. Target small, low‑risk moves (roughly 10–15 handles), use a one‑for‑one model, place stops, and accept that outcomes don’t matter for the exercise.
– Mindset and psychology: primary goal is to desensitize to fear/need-to-be-right. Record emotional reactions, keep a journal, narrate and review your screens, and build repetition/experience rather than seeking instant profits or highlight trades.
– Market commentary: the session’s market was “sloppy,” choppy and fast, with decoupling between indices and occasional order-fill glitches on TradingView. Such hard conditions are exactly where practicing is most useful.
– Practical tips: do drills for short periods (15 minutes/day minimum), screenshot glitches/fills, record yourself narrating price action, focus on process not outcomes, and keep edge sharp by ongoing practice even after profitability.
– Final point: there are no shortcuts — consistent practice, honest journaling, and accepting short‑term failure are required to develop reliable trading skills.
Quiz
1. According to ICT, what should traders do when there is nothing on the chart to work with?
A. Enter anyway to stay active
B. Wait and do nothing
C. Increase position size
D. Trade the opening bell only
2. What did ICT say is the purpose of these drills?
A. To make money quickly
B. To build a highlight reel for social media
C. To practice participation in price action without fear or money pressure
D. To predict every market move correctly
3. What target range did ICT repeatedly say he was looking for in these drills?
A. 1 to 3 handles
B. 5 to 8 handles
C. 10 to 15 handles
D. 25 to 30 handles
4. What did ICT say about using live trading accounts for these drill examples?
A. They are meant to be copied directly into funded accounts
B. They should only be used on futures contracts
C. They are not trade entries to copy into live or funded accounts
D. They only work during the London session
5. What market condition did ICT say would make him reluctant to participate?
A. Clean price action with open traffic
B. Fast, loose, low resistance liquidity run conditions
C. Messy, choppy, range-bound price action with shared candle ranges
D. A market with large clean imbalances and expansion
Answer Key with Evidence
1. B. Wait and do nothing
Evidence: “So if you have nothing to work on, you sit still.” He also said, “If there’s nothing in the chart, don’t force it.”
2. C. To practice participation in price action without fear or money pressure
Evidence: “You’re just simply looking for something to engage with to get accustomed to the watching price action… You got to get that baseline foundation of experience. And don’t be afraid.” Also: “Drills are simply looking for small little participations in price action with no monetary hope of making money and no fear of losing.”
3. C. 10 to 15 handles
Evidence: “think about how, say for instance, 10 to 15 handles. Okay? So, that’s a really good small low-hanging fruit objective to look for”
4. C. They are not trade entries to copy into live or funded accounts
Evidence: “please don’t take these as trade entries for you to put on your funded accounts. Do not try to copy them for your live account trading. If you’re here to do that, I promise you I’m going to hurt you.”
5. C. Messy, choppy, range-bound price action with shared candle ranges
Evidence: “when the candlesticks are all parked next to each other it’s like you trying to go northbound or southbound on interstates. And it’s frustrating.” Also: “When it’s like that… you’re more prone to see a lot of continued consolidations.” He described it as “high resistance liquidity run conditions” and “very messy.”
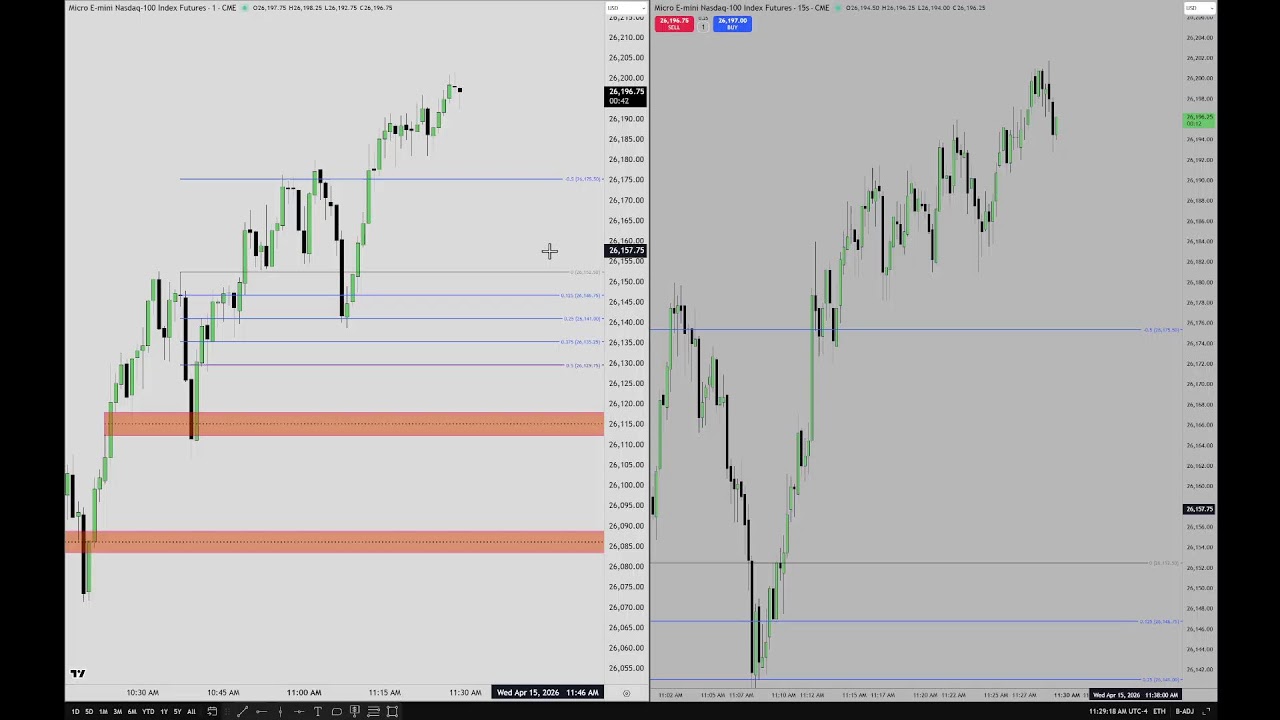
– Hosting a live tape-reading session focused on price action around the regular trading-hours opening range and the opening gap. The main technical hooks: opening range gap, consequent encroachment, fair value gaps (FVGs), inefficiencies, and buy/sell liquidity pools. – Market context: peace negotiations failed over the weekend (geopolitical risk), which created a big gap lower at the open. ICT remained neutral and observational—no trade taken—because price action was ambiguous and low probability. – Key technical thesis: watch whether price reclaims the consequent encroachment and closes the full gap. If it closes and accelerates higher, the speaker expects continuation up; if bodies close into the upper half of inefficiencies or fail to reject key levels, that supports a bearish retracement. – Practical entry criteria: prefer one‑sided, high-probability setups (clear imbalances, reclaim/inversion FVGs, confirmed lower‑timeframe FVGs). Don’t trade “tries” or guess—wait for confirmation on the body close, not just wicks. – On stop hunts and liquidity: algorithms hunt stops and engineered liquidity; recognize stop hunts and then look for opposing liquidity as the next target instead of panicking. – Teaching focus: live demonstration of tape reading in difficult/mixed conditions to build anticipatory skills rather than reactive guessing. Emphasis on learning to identify warning signs (“canary” analogy) when price is reluctant to behave as expected. – Process advice: take shorthand notes while watching, later annotate charts and keep a study/journal of observations, emotions and outcomes. This builds experience and improves anticipation. – Psychological guidance: accept uncertainty; don’t force trades for ego or social media clout. Avoid copying signals or chasing influencers who “try” trades without conviction. – Performance goal: aim for repeatable, high-probability setups (targeting ~70%+ edge), not constant activity. Expect to sit out many sessions until criteria align. – Macro view: speaker expects cleaner, more one-sided markets when a new Fed chair is installed, which could draw sidelined money back in; but current event-driven volatility requires extra caution.
Overall: read price action patiently, rely on clearly defined FVG/imbalance criteria and lower‑timeframe confirmation, journal everything, and only trade when the market shows one‑sided, high‑probability behavior.
Quiz
1. According to ICT, what is a warning sign that a trade setup may have lower probability? A. Price immediately respects the PD array and runs in the expected direction B. Price hesitates, wicks around, and does not show one-sidedness C. Price moves cleanly with strong follow-through D. Price closes beyond the expected target
Answer Key with Evidence:
1. B — “If you can see the PD arrays in price action and they’re not really adhering to the logic… that’s usually indicative of a lower degree of probability in your favor.” Evidence: “If you can see the PD arrays in price action and they’re not really adhering to the logic that would be implemented with them as I teach it, that’s usually indicative of a lower degree of probability in your favor.”
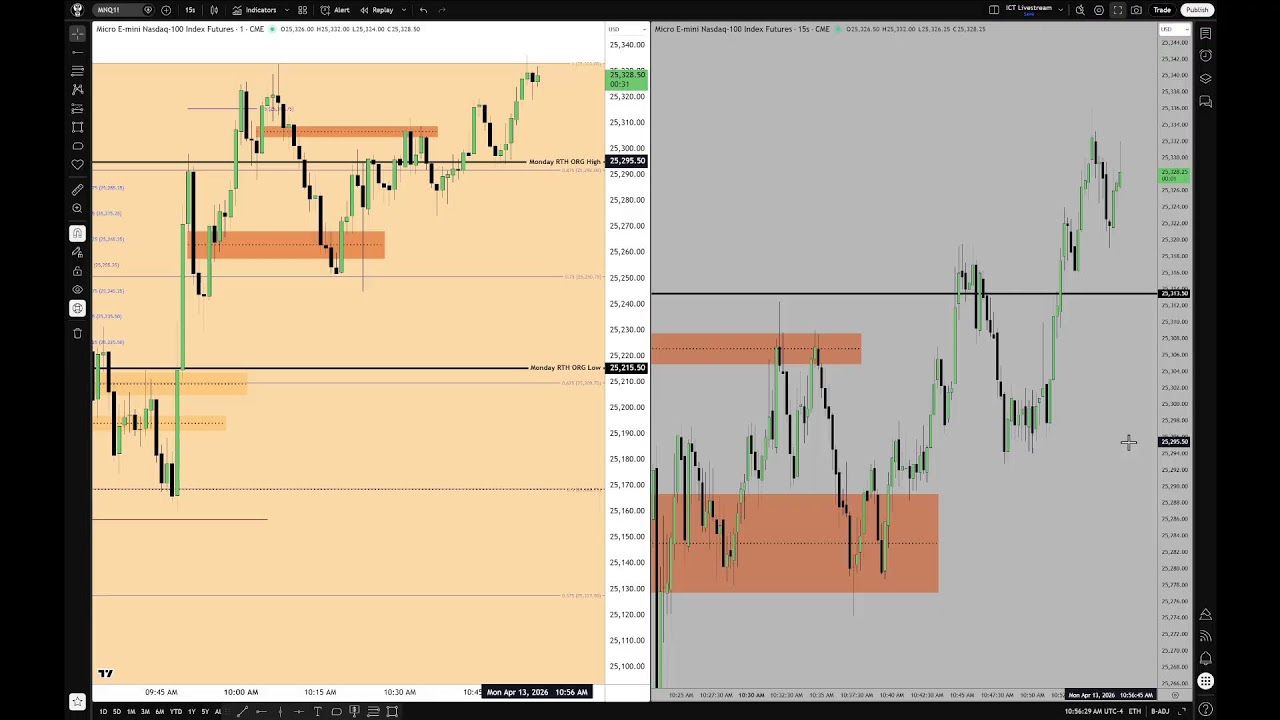
– Topic: using the continuous contract (vs front-month/delivery contracts) when analyzing micro E-mini NASDAQ futures (MNQ). The speaker demonstrates why he toggles the continuous contract on/off: not to find fair value gaps, but to reveal volume imbalances (suspension blocks) and historical price structure that the front-month data can miss when contracts roll.
– Practical reason: the continuous contract smooths historical gaps and can show different important levels (breakers, volume imbalance highs/lows, consequent encroachment, half-gap). He compares the two views and uses whichever set of levels price respects for intraday decisions.
– Key technical points: read candlestick bodies and wicks as order-flow footprints (wicks often indicate the first-presented fair-value gap; bodies indicate heaviness/strength). Use PD arrays, suspension blocks, octants/quadrants, and “event horizon” midzones to measure targets and sensitivity.
– Trading approach: focus on index futures and the first hour of regular trading (9:30–10:30). The opening-range half-gap/consequent encroachment is a high-probability intraday objective (he cites ~70%); prioritize low-hanging fruit (smaller, higher-probability targets) rather than chasing large moves. Use lower timeframes to practice entries, place proper stops, and build a repeatable model.
– Pedagogy and warnings: don’t over-rely on fundamentals, indicators, heatmaps, or paid gimmicks; learn to read price/time and develop your own model through journaling and disciplined practice. Expect the market to be noisier and manipulated at times; risk-manage and avoid overleveraging.
– Logistics/upcoming: he recorded this live, will post further material (a lecture on journaling and sessions on practicing entries, order blocks and fair-value-gap strategies), and asks students to refer others to this video when asked about the continuous-contract function.
Quiz
1. What does ICT say he primarily uses the continuous contract for?
A. To find fair value gaps only
B. To look for volume imbalances and compare key levels
C. To analyze forex pairs
D. To identify earnings reports
2. Why does ICT say he toggles the continuous contract setting on and off?
A. To change the chart color scheme
B. To compare different contracts and locate volume imbalances
C. To remove all historical data
D. To draw trendlines more easily
3. According to ICT, what is the first draw or initial bias for the session when price opens above the consequent encroachment level?
A. Look for sell-side liquidity
B. Look for buy-side liquidity
C. Ignore the opening range
D. Trade only gold
4. What does ICT say a wick can indicate when price cannot leave bodies above a key PD array in bullish conditions?
A. Bullish continuation
B. Premium sensitivity
C. Bearish heaviness
D. No useful information
5. What does ICT recommend new students focus on first when developing a model?
A. The first 60 minutes of trading, especially the first 30 minutes
B. Yearly charts only
C. Earnings season
D. News headlines
Answer Key:
1. B Evidence: “I predominantly start my analysis on the continuous contract… I’m only toggling on the continuous contract. I’m only using this function here to see where those volume imbalances are.” 2. B Evidence: “The only time I’ve ever utilized this function here is when I’m looking for volume imbalances… I’m looking for where volume imbalances exist.” 3. B Evidence: “If we have a market that has a discount opening range gap… my initial bias for session… I’m going to be looking for price to go up to the half gap. So I’m going to be looking for what? Buy side liquidity.” 4. C Evidence: “When it does that, that’s proving heaviness. Heaviness is bearishness. It’s not showing strength to continue higher.” 5. A Evidence: “What is a good way of starting… to help you understand at least the first hour trading?… Between 9:30 and 10:30, that first hour’s dealing range…”
– Market recap: The CPI print was weak and price failed to reach a key daily suspension/block level. The speaker is watching several technical levels — opening-range gap, fair value gaps (FVGs), liquidity sweeps, and rejection/inversion zones — with a bias toward lower prices if certain lows (including the CPI low and midpoint of the opening-range gap) are taken out.
– Technical observations: There’s SMT divergence between the three major averages (ES, NQ, Dow), making price action messy and lowering conviction. ICT refuses to chase longs into a decoupled rally and would prefer to see clean accelerations into sell-side liquidity to confirm downside moves.
– Trade note: He accumulated size into an inversion/fair-value gap, added on retracements, and suffered slippage on an exit near 325. He would lose interest in morning trading if key rejection blocks hold; might look for a lunch or PM session move instead.
– Teaching point: For newer traders, decoupling across indexes complicates market structure and requires caution; high-probability setups rely on agreement among averages and clear one-sidedness.
– Personal incident: While dropping his son off, an aggressive driver confronted him, pulled a gun, then lowered it and called someone. He drove away for safety and may file a report if dashcam evidence exists. Lesson: avoid confrontation and stay safe.
– Wrap-up: He’s ending the live session due to lack of meaningful price action, will post a review later, and plans a Twitter space on Saturday. Wishes viewers a safe, relaxing weekend.
Quiz
1) What was ICT’s main concern about the market direction after the CPI reading? – A. He was looking to chase the market higher – B. He expected a guaranteed rally into the close – C. He was watching for possible downside liquidity to be taken – D. He believed the market had become completely untradeable
2) How did ICT describe the condition of the three major averages during the session? – A. They were all perfectly aligned – B. They were decoupled and not in agreement – C. They were all making new highs together – D. They were all closed for the session
Answer Key with Evidence
1) C. He was watching for possible downside liquidity to be taken. Evidence: “I’m just saying that it could go down here and take that liquidity. This morning, I’ll be watching for that.”
2) B. They were decoupled and not in agreement. Evidence: “So, already we can see some decoupling. Okay, decoupling is when the averages do not agree.” Evidence: “You can see clearly this is what decoupling looks like, okay?”
– Quick 15-minute review of Micro Nasdaq (MNQ); refer to this morning’s full live stream for background. Host may be off tomorrow depending on personal plans.
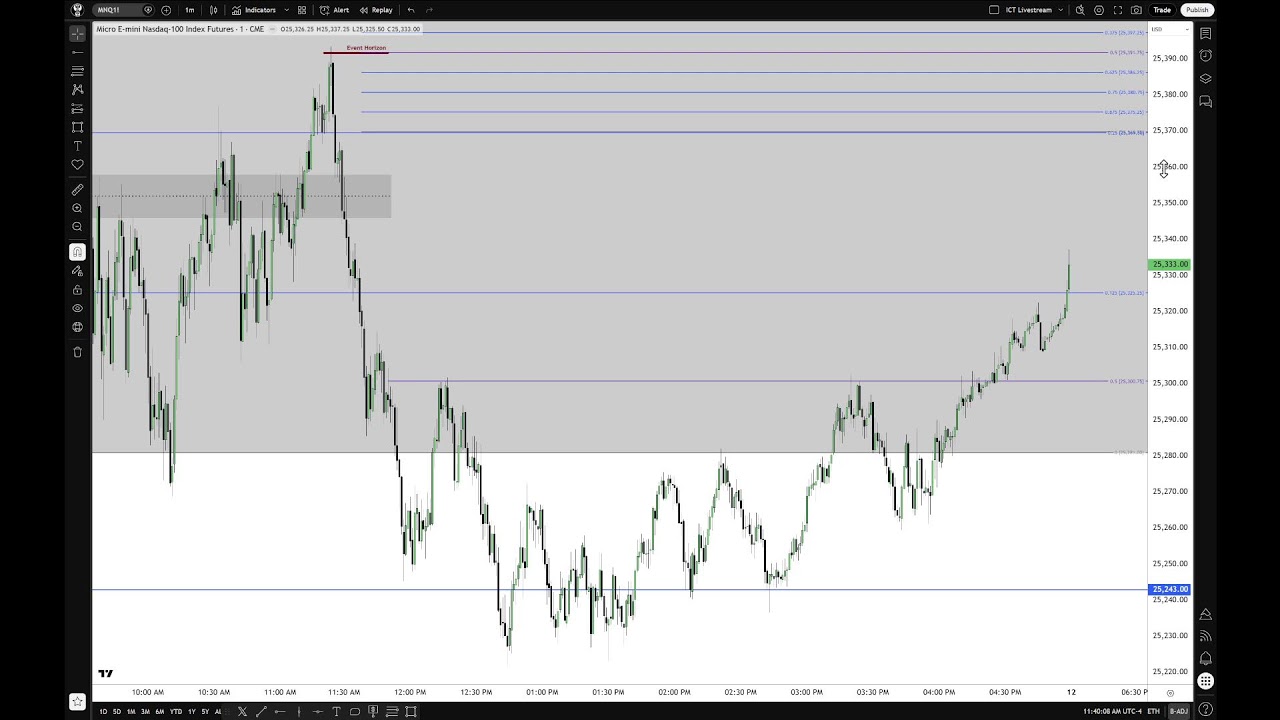
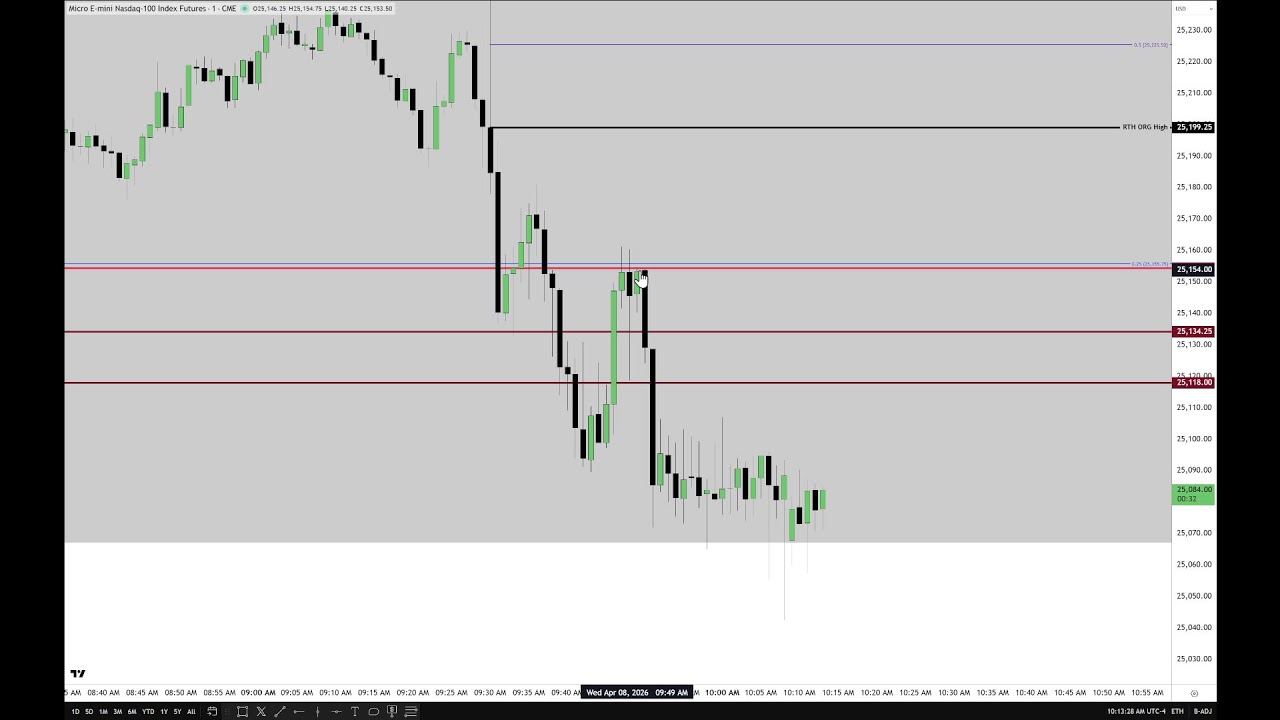
– Market opened with a large regular-trading-hours opening-range gap (RTHORG) driven by headlines. Price ran up into the daily suspension block area, then rolled over and hit the speaker’s target: the low of the daily suspension block.
– Key technical read: a 9:30–9:31 fair-value gap formed. The presenter emphasizes the rule that candlestick bodies failing to trade into key levels (wicks may touch but bodies do not) is a bearish signature used to anticipate further decline. Price retraced into the lower part of the daily suspension block but failed to reach the upper half/octant—another bearish sign—so the bias remains down toward consequent encroachment unless price behavior changes.
– Caveat: geopolitical developments (missiles/ceasefire reports) can produce volatile overnight/Asian-session moves; the 6:00 (Asia open) price will determine the next actionable bias.
– Trading advice: use less leverage, avoid overtrading, seek confluence, be nimble and accept partial moves.
– Logistics: may post an update around 7:30 on X; otherwise family plans come first.
– ICT is live-streaming a morning Nasdaq (NQ) tape‑reading session and will ignore the FOMC minutes as likely uneventful. – Key technical focus: a large opening‑range premium gap, a daily “suspension block” with a consequent encroachment, and the low of a shaded box (daily suspension block lower quadrant) as the primary target for the morning. – Market context: price action has been influenced by noisy geopolitical headlines (Strait of Hormuz/ceasefire) and likely algorithmic/manipulative behavior; bodies avoiding a key line is read as bearish. – Intraday plan: watch for fills into sell‑side liquidity pools, prefer small position size (micro contracts), take partial profits, protect stops above the wick/encroachment, and only re‑enter cautiously if conditions remain clear. – Trading method: simple tape‑reading—focus on open/high/low/close, liquidity and price behavior on 1‑minute candles rather than complex indicators, footprint, or replay gimmicks. – Practice advice: record live sessions (e.g., OBS), study individual candles, journal expectations and emotional triggers, paper‑trade for a minimum 6–8 weeks to build consistent directional read skill. – Mindset emphasis: protect capital, be disciplined, avoid social‑media noise and overtrading, control fear and arrogance, and adopt slow, repeatable processes rather than seeking shortcuts.
Quiz
1. What did ICT say was the best way to learn tape reading? A. Use market replay only B. Trade multiple contracts immediately C. Watch live price action and record each candle D. Focus on footprint and level 2 data
2. What did ICT say about when a trader should start paper trading? A. Immediately after watching one live session B. After becoming consistently accurate for 6 to 8 weeks C. Only after using market replay for a month D. Only after trading a live account successfully for a year
Answer Key with Evidence
1. C Evidence: “The fastest way you can do it. There is no faster shortcut than simply placing yourself in front in front of price action without any monetary concern” “You need to be able to watch the open, high, low, and close form real time.” “record your screen”
2. B Evidence: “Any retracement needs to be kept at a a maximum of just the lower quadrant.” “If it trades down below it here intraday, I would not want to see it trade back to that halfway point.” “Anything climbing back above after we leave this sets the stage for a run for intraday high.”
– The speaker links recent extreme market moves to geopolitical developments (Trump’s threats to Iran, Pakistan reportedly advising a different course, Iran’s defiance and public positioning around targets). He suggests a possible tactical delay (a two‑week window contingent on reopening the Strait of Hormuz) may have been used to disperse civilians, buying time for a later strike — but he stresses this is his speculation.
– Crude oil was highly volatile (big gap and a sharp drop from ~$109+ toward the low $90s), but he remains fundamentally bullish on oil — the recent decline may have washed out longs, not ended the uptrend. Oil remains event-driven and can spike quickly if attacks occur.
– Markets are being driven and amplified by headlines and off‑hours moves (stock index futures jumped, crude plunged). Single‑minute candlesticks have moved by hundreds of handles, demonstrating extreme intraday volatility.
– Trading advice and risk warning: stay out of these markets if inexperienced or thinly funded; use stop losses; treat this year as an education year rather than taking big risks. Manipulation/insider positioning can create quick, damaging moves.
– Technical/read‑on‑the‑tape notes: dollar index slipped, euro/pound are mixed (pound showing relative strength), stock futures (MES/MNQ) show bullish structure if they hold above recent upper halves of ranges and inefficiencies; gold/silver also touched inefficiencies but are risky to trade now.
– Because of the volatile, event‑driven environment and his responsibility as an educator, he will scale back live trading/tape‑reading streams and focus on educational content for a while to avoid influencing followers into risky trades.
– He emphasizes the human cost of the conflict, the emotional difficulty of trading such markets, and urges prudence and humility given the high uncertainty.
Quiz
1. According to ICT, what was one reason he believed the announced attack on Iran may not happen immediately?
A. The markets had already closed for the week
B. Pakistan advised a different avenue and people were standing around the targets
C. Crude oil had already reached its final target
D. The Strait of Hormuz had already been opened
2. What did ICT say the market reaction after hours suggested about crude oil and stock index futures?
A. Crude oil rose sharply while stock indices collapsed
B. Both markets stayed unchanged
C. Crude oil dropped hard while stock index futures rallied sharply
D. Gold and silver were the only markets affected
3. What did ICT repeatedly advise inexperienced traders to do in this environment?
A. Trade only with higher leverage
B. Ignore stop losses and hold through volatility
C. Stay away from the market and use the time to study
D. Focus only on shorting crude oil
4. What did ICT say he expected would happen if crude oil moved higher again after the drop?
A. Crude oil would probably stay flat for months
B. Oil prices could rise parabolically if attacks resumed
C. The dollar would instantly collapse to zero
D. Gold would become the only tradable market
5. What was ICT’s view on the possibility of a ceasefire?
A. He believed a ceasefire was fully confirmed and permanent
B. He thought the ceasefire would definitely open the Strait of Hormuz immediately
C. He viewed it as temporary theater and doubted it would last
D. He said the ceasefire would eliminate all market volatility
Answer Key:
1. B
Evidence: “a course of action has been suggested to the Trump administration by Pakistan and a uh They counseled him to consider a different avenue” and “they gave an a reason to to let the people go home and get away from those targets.”
2. C
Evidence: “we’re up 600 plus handles on stock index futures, and crude oil’s down you know, tens of thousands of dollars per contract” and “crude oil opened up on that news. Sold off.”
3. C
Evidence: “If you’re not experienced… this is not your year. I promise you you’re you’re you’re going to regret probably doing anything with it” and “Take this year as an education year. Spend it studying. Learn some concepts. Study. And remove yourself from the risk.”
4. B
Evidence: “if they come back later on and do all the attacks they said and Iran said they were going to respond by hitting everything in the area oil-related and other… that’s going to obviously cause, you know, parabolic rise in oil prices.”
5. C
Evidence: “I don’t foresee the Strait of Hormuz becoming open immediately” and “I just I can’t see 2 weeks… This might be just a temporary little speed bump in what may continue going on” and “It’s all theater. It’s all It’s nonsense. There’s no easy answer to this. It’s a mess.”
ICT gives a ~15-minute live review of the Micro Nasdaq (MNQ) price action, noting they may not stream tomorrow. He says viewers should also watch his earlier live stream because it explained the moves in real time.
Key technical points: a large regular-trading-hours opening-range gap formed after geopolitical headlines, price rallied into the midpoint of a daily “suspension block,” then fell to the block’s low (his target) and spent time trading in the lower half of that block.
He highlights a “fair value gap” (a buy-side inefficiency) and a recurring signature he uses: whether candlestick bodies — not just wicks — can touch key levels. Because the bodies failed to trade into the upper half of the suspension block (and could not touch certain levels), he interprets the structure as bearish and expects further downside unless price clears those levels at the next open.
He warns that off-hours geopolitical developments could change the picture at the 6:00 open, so be prepared. Practical advice: use less leverage, avoid overtrading, require stronger confluence before committing, be nimble and satisfied with partial runs. He closes noting family commitments and that he’ll post if he streams later.
Quiz
1. According to ICT, what is the key sign of bearishness when price retraces into a premium level? A. The wicks must touch the level B. The bodies cannot touch the level C. Price must close above the level D. Volume must increase
2. What did ICT say happens after price fails to get back up into the upper part of the daily suspension block? A. It becomes bullish B. It usually trades to consequent encroachment C. It immediately reverses to all-time highs D. It stops trading for the day
Answer Key:
1. B Evidence:“…if the bodies of the candlesticks can’t touch them… if the bodies can’t touch this key level while potentially being bearish… that’s bearish.” 2. B Evidence: “When it fails to get there, is that bullish or bearish? It’s bearish… I would look for that to eventually still try to work its way down to consequent encroachment right here
– ICT is focused on the micro NASDAQ this morning (despite FOMC minutes later) and watches one primary level: the low of a daily “suspension block” (shaded gray box) formed by a very large opening-range gap. – Key technical idea: price should draw to that low; if it breaks below, intraday retracements must stay in the lower quadrant (not reclaim the midpoint) for bearish continuation. Several downside targets were hit already. – Trading posture: be cautious — ICT would protect stops, take partial profits, and avoid overtrading. This commentary is observational, not trade advice. – Market context: volatility is amplified by geopolitical headlines and possible misinformation; that increases range and manipulation, so expect larger moves and be conservative. – Methodology emphasized: simple tape-reading (open/high/low/close, liquidity and inefficiencies) is sufficient — no complex indicators, footprint, or social-media hype needed. – Practice advice: watch live price action or record your screen, study individual one-minute candles, keep a study journal of expectations and emotions, and paper-trade consistently for 6–8 weeks before scaling up. – Psychological guidance: manage ego, fear, and overconfidence; learn to stop when you’re disciplined and “be content with enough.” Avoid chasing vanity metrics on social media. – Bottom line: focus on a few clear levels, practice disciplined tape-reading, protect capital, and develop emotional control — simplicity and repetition are the fastest path to consistent progress.
Quiz:
1. What did ICT say about using market replay instead of live recorded price action? A. It is better than live recording because it shows every tick B. It is the best method for learning order flow C. It is less useful because it only gives two updates per candle D. It should be used exclusively instead of tape reading
2. What did ICT recommend as a starting exercise for developing traders? A. Trade multiple contracts in a live account immediately B. Watch live price action and learn where the market is likely to draw to C. Use Elliott Wave and footprint charts first D. Focus on social media trade calls and copy them
3. What did ICT say about having a plan B in trading? A. Plan B is necessary for every setup B. Plan B helps reduce emotional pressure C. There should be no plan B, because it creates a scheduled exit to quit D. Plan B is only for demo accounts
Answer Key:
1. C — “market replay… it only seeing how it opens with a little bit of a flurry price action and then in the last little bit of movement. So, it’s only two updates to every new candle” 2. B — “The first rule of engagement… is to know where it’s likely to go to… you have to submit yourself to watching these individual candlesticks” 3. C — “There cannot be plan B. Okay? There’s no plan B… You just scheduled the exact premise why you’re going to quit and then fail.”